
Thanks for the feedback, I think the plan is to keep this chart based on the configuration reports in the respective tabs. FYI @lzap @MariSvirik @amirfefer
1 Like
The chart will definitely not be with Foreman 3.2 but we would like to get it back. It was quite heavy on resources thos as it needs to load 7 days of reports, parse all metadata (YAML) and draw the stuff. In the new design, this is not changing - it just needs to load whole report body (JSON).
Having said that, this should have been using Rails Cache from the day one, so at least we can ensure that once this is fetched once in 30 minutes (the puppet interval), we can grab it from cache quickly.
1 Like
I’ve found the need to go back to the old UI in order to check on broken templates
1 Like
Thanks @James_Shewey, could you please describe the flow in more details? Do you go to the templates tab and “Review” the e.g. provisioning template? Perhaps the list of associated templates would be a good addition to the new Details tab.
@Marek_Hulan - Yes that is correct. From host Host Overview, I then click the Legacy UI option, then click the templates tab and then click on the upside-down carat (^) symbol or down arrow and right click on “review” and open in new tab (Loading the page while losing the navigation interface has always felt clunky to me and that was my workaround).
It would definitely be great to have that on the details page. I don’t care if it gets buried somewhere as long as I will still be able to get to it when the old UI goes away.
As an aside, in Chrome, I am unable to change tabs when in a content view. So if I am on https://example.com/content_views/4#/versions, for example I have to manually go to the address bar and change the URL to https://example.com/content_views/4#/repositories in order to view/switch to the “Repositories” tab in 3.2.
If my understanding is correct the switcher will be fixed by a cherry pick, see Foreman core Maintainers meeting on 2022-04-06
1 Like
New UI has a great potential. If it will be possible to add some tiles with info from old hosts page, like HW, OS, Facts… all on tiles which you will be able to enable/disable and move as you like.
Totally, there’s a PR that adds the details tab, which should be full of information. They can be collapsed (and such preference will be stored for the user) so one could tailor, what all is relevant.
2 Likes
I would like to see the old button to “schedule remote job” on the host.
Now I have to go to “Monitor → Jobs”.
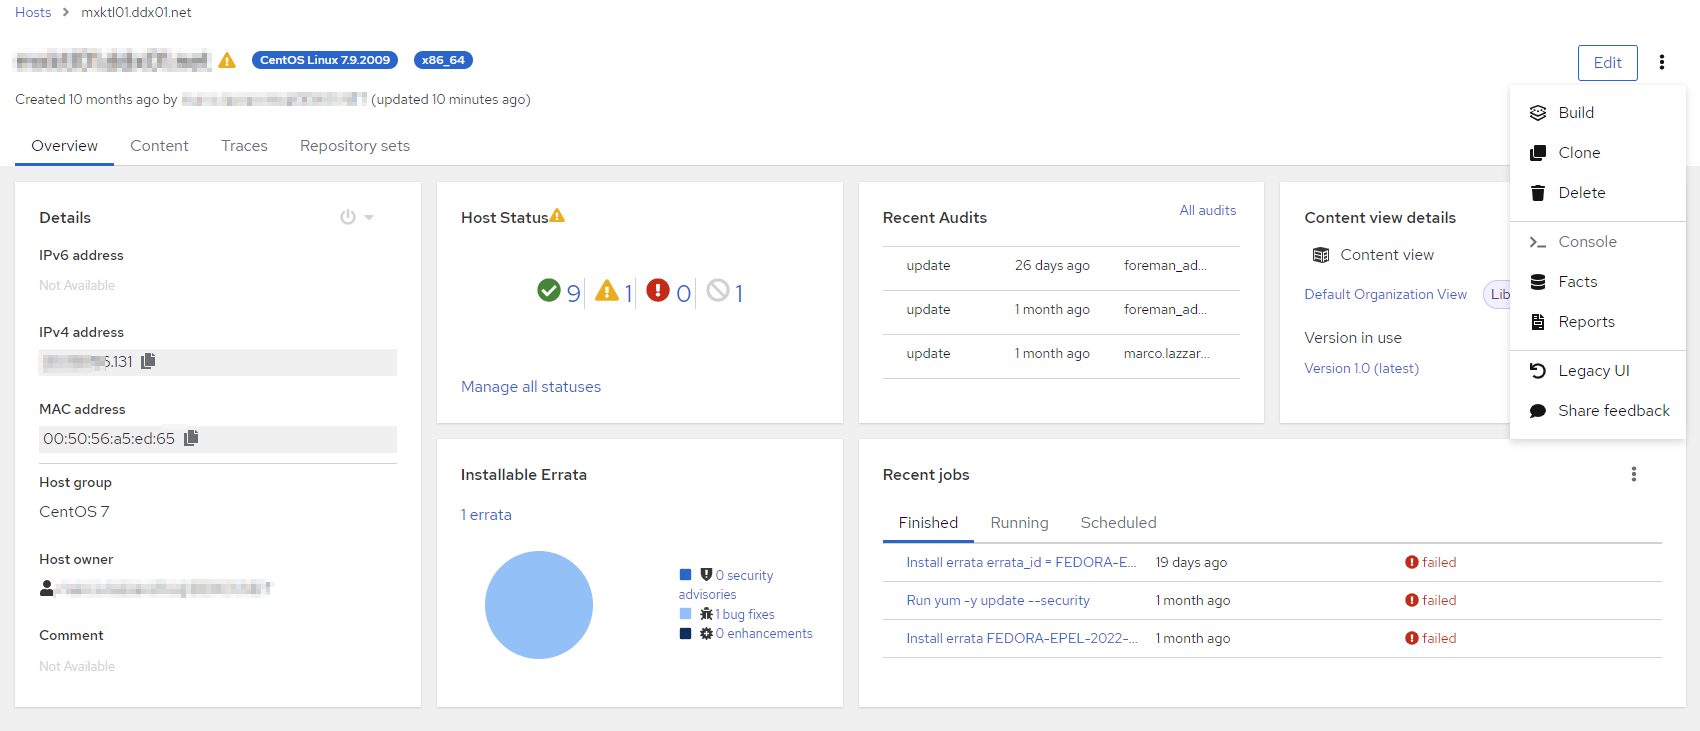
And what is the “>_ console" button”? Mine is disabled.
I’m not sure what version you’re on, but the button is still there in the top right corner.

IIRC that’s access to a serial line-like console for machines which support it. It is quite possible that previously it was hidden if unavailable, but now it is shown, but disabled.
Not sure if anyone has mentioned this yet, but the Web Console button is missing from the new UI, or I am at least not finding it. Need to revert to legacy/old ui to get to it.
if it’s a VM, it takes you to the relevant console (console output from AWS, VNC/SPICE etc)
newer version of REX already adds that to the kebab menu

2 Likes
My org recently upgraded to 3.2, here’s some of my feedback:
- Our compliance requires requires rebuilding of hosts every few months, so easy access to the build button on the host page has been valuable our org. Having it or at least some indicator of build mode status visible without a dropdown would be nice.
- The “Templates” tab from the old view is very useful for troubleshooting; that is something I regularly have to flip back to the old view for.
- The new “Recent audits” tile is pretty nice!
- Could “Host Group” under the “Details” tile be made a link to the host group again? This is important considering the full path of the host group is not shown anymore and two different nested host groups could have the same name.
2 Likes
@mymindstorm Thanks for the feedback!
Could “Host Group” under the “Details” tile be made a link to the host group again?
Great idea. I will look into doing this.
About the ‘Templates’ tab and build button, thoughts @Ron_Lavi or @Marek_Hulan ?
2 Likes
Gotcha, now it’s hidden in the kebab menu. I think we will revisit this when the kebab menu is full of actions. It may be good to add a Provisioning overview card so it’s immediatelly clear, what’s the status of it. I suppose that would only be displayed if the Host has build status defined.
For the templates, we’re tracking the following stories in upcoming version or two.
- As a user I’d like to see all assigned provisioning templates for the Host in the Details tab
- As a user, I can review the assigned provisioning template I see in the Details tab, the result should not force me to leave the page.
1 Like
I’m on version 3.2.1 of Foreman and 4.4.0.2 of Katello, and I don’t have that button
What is your Remote Execution plugin version? Find it under Administer → About → Plugins. 7.1.0 has it for sure, based on what I see in github, is was introduced in 6.1.0 by Fixes #34260 - add rex features dropdown to host page · theforeman/foreman_remote_execution@1e337b8 · GitHub
I think it would be extremely helpful to have something like:
for the new UI. It could add either a completely new tab, or cards to the “Details” tab. This would allow users to add interesting facts or host parameters of their own choice for hosts.
For example, we use it to add a link to the BMC web page (if available), planned reboot times, RTC wake times for machines, machine location data (room, network switch etc.) and much more. This can probably not be captured in a generic way, so it would be best to have something configurable e.g. via YAML.
Is this on the roadmap?
I’d recommend to have a look at Foreman 3.5. From there it would be interesting to see what you still miss.
It sounds like a lot of that information comes from custom facts. Perhaps you can describe how you determine this information and how you’d like to see it presented.
1 Like
Indeed, I’m looking forward to the release 
Exactly, the source are both host parameters (manually maintained) and custom facts. To give an idea, here’s the list of :content: rows of the foreman_column_view configuration:
    :content: facts_hash['uptime']
    :content: params['location']
    :content: params['room']
    :content: params['rack']
    :content: params['bay']
    :content: params['comment']
    :content: params['commissioning_date']
    :content: facts_hash['rtcwake_alarm']
    :content: facts_hash['rtcwake_alarm_time_human']
    :content: facts_hash['rtcwake_wish_time_human']
    :content: facts_hash['dmi::product::serial_number']
    :content: link_to(_("Console"), "https://#{host.interfaces.first.name}", { :class => "btn btn-info" } )
    :eval_content: true
    :content: facts_hash['reboot_required']
    :content: facts_hash['reboot_required_pkgs']
    :content: facts_hash['reboot_required_since']
Since “custom” is by design “custom”, what I’d love would be the possibility to add custom cards with custom rows, with simple “label” => “value” pairs, similar as to what foreman_column_view was doing, but with the possibility to add cards to group this information.
For example, I’d then create a location card, which contains the location, room, rack and bay host parameters we maintain manually, maybe extended with network facts like to which switch-port a machine is attached (via custom facts).
I’d similarly create a card with reboot information and rtcwake information, for example. To give an idea, the rtcwake data is populated by calling rtcwake -m show, and we manage RTC wakeup times with Puppet to conserve energy for machines and wake them up at specific times (with a very large variety of desktops, this works more reliably than Wake on LAN).