Problem:
After upgrading from 1.22 to 1.23, foreman seems to drive itself into a bit of a tizzy.
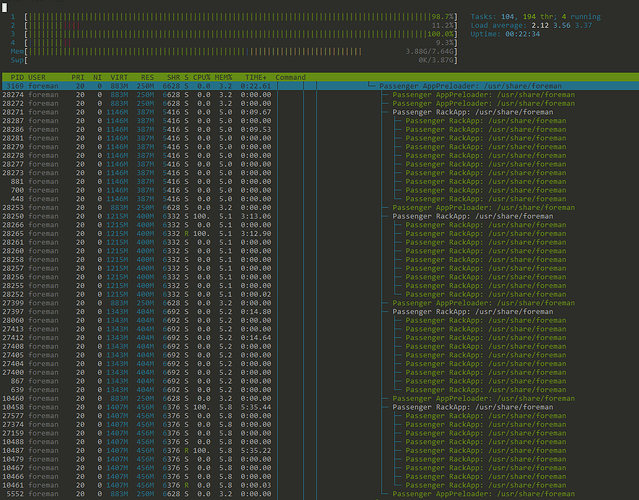
It usually takes a good 10-20 minutes for the problem to become noticeable, but at this point the vm foreman is running on, is at a high load average, with all it’s cores at 100%.
Expected outcome:
Regular/normal CPU usage.
Foreman and Proxy versions:
Foreman and primary Smart Proxy - 1.23
Installed using foreman-installer
Upgraded from 1.21.1 to 1.22 to 1.23
Plus an additional 2 smart proxys still running 1.22
Foreman and Proxy plugin versions:
Foreman plugin: foreman-tasks, 0.16.2, Ivan Nečas, The goal of this plugin is to unify the way of showing task statuses across the Foreman instance.
It defines Task model for keeping the information about the tasks and Lock for assigning the tasks
to resources. The locking allows dealing with preventing multiple colliding tasks to be run on the
same resource. It also optionally provides Dynflow infrastructure for using it for managing the tasks.
Foreman plugin: foreman_ansible, 3.0.5, Daniel Lobato Garcia, Ansible integration with Foreman
Foreman plugin: foreman_default_hostgroup, 5.0.0, Greg Sutcliffe, Adds the option to specify a default hostgroup for new hosts created from facts/reports
Foreman plugin: foreman_discovery, 15.1.0, Aditi Puntambekar, alongoldboim, Alon Goldboim, amirfefer, Amit Karsale, Amos Benari, Avi Sharvit, Bryan Kearney, bshuster, Daniel Lobato, Daniel Lobato Garcia, Daniel Lobato García, Danny Smit, David Davis, Djebran Lezzoum, Dominic Cleal, Eric D. Helms, Ewoud Kohl van Wijngaarden, Frank Wall, Greg Sutcliffe, ChairmanTubeAmp, Ido Kanner, imriz, Imri Zvik, Ivan Nečas, Joseph Mitchell Magen, June Zhang, kgaikwad, Lars Berntzon, ldjebran, Lukas Zapletal, Lukáš Zapletal, Marek Hulan, Marek Hulán, Martin Bačovský, Matt Jarvis, Michael Moll, Nick, odovzhenko, Ohad Levy, Ondrej Prazak, Ondřej Ezr, Ori Rabin, orrabin, Partha Aji, Petr Chalupa, Phirince Philip, Rahul Bajaj, Robert Antoni Buj Gelonch, Scubafloyd, Sean O'Keeffe, Sebastian Gräßl, Shimon Shtein, Shlomi Zadok, Stephen Benjamin, Swapnil Abnave, Thomas Gelf, Timo Goebel, Tomas Strych, Tom Caspy, Tomer Brisker, and Yann Cézard, MaaS Discovery Plugin engine for Foreman
Foreman plugin: foreman_remote_execution, 1.8.2, Foreman Remote Execution team, A plugin bringing remote execution to the Foreman, completing the config management functionality with remote management functionality.
Foreman plugin: foreman_templates, 6.0.3, Greg Sutcliffe, Engine to synchronise provisioning templates from GitHub
Other relevant data:
This is an example, before the cpu get’s locked, and load average shoots up past 10…
Here, there is already 2 processed that look like they are stuck.
logs
Any suggestions on where to look next?
As far as i can tell, the production log looks fine.

