on the last demo I presented my proposal for telemetry (it is actually
a separate video). I am looking for non-intrusive approach with broad
integration possibilities:
This was also showed on our demo last week (the same content):
I am starting this thread to gather feedback before I open a PR with
this. Currently the code is mostly in Rails initializer and looks like
this:
# get telemetry singleton instance and setup it
telemetry = Foreman::Telemetry.instance.setup(... some options ...)

# register measurements
telemetry.add_counter(:http_requests, 'A counter of HTTP requests
made', [:controller, :action])
telemetry.add_histogram(:http_request_total_duration, 'Total
duration', [:controller, :action])
telemetry.add_counter(:activerecord_instances, 'Number of instances of
AR models', [:class])
send measurements from Rails instrumentation or from code base
The proposed API is a single class (a singleton actually) with three
registering methods and three measure methods. I don’t think such a
simple class needs proper separation of concerns, but we can talk
about this in the PR. The registration part could be turned into some
kind of DSL, currently it takes metric name, description and list of
keys which will be part of an instance for those frameworks which do
not support arbitrary amount of key-value pairs.
If there are no objections, I will add settings and better error
handling and file the PR.
How would folks disable it opt out of sending this data?
···
On Nov 20, 2017 9:46 AM, "Lukas Zapletal" <lzap@redhat.com> wrote:
Hey,
on the last demo I presented my proposal for telemetry (it is actually
a separate video). I am looking for non-intrusive approach with broad
integration possibilities:
This was also showed on our demo last week (the same content):
I am starting this thread to gather feedback before I open a PR with
this. Currently the code is mostly in Rails initializer and looks like
this:
# get telemetry singleton instance and setup it
telemetry = Foreman::Telemetry.instance.setup(... some options ...)
# register measurements
telemetry.add_counter(:http_requests, 'A counter of HTTP requests
made', [:controller, :action])
telemetry.add_histogram(:http_request_total_duration, 'Total
duration', [:controller, :action])
telemetry.add_counter(:activerecord_instances, 'Number of instances of
AR models', [:class])
# send measurements from Rails instrumentation or from code base
telemetry.increment_counter(:http_requests, 1, :controller =>
controller, :action => action, :status => status)
telemetry.observe_histogram(:http_request_total_duration, duration,
:controller => controller, :action => action)
The proposed API is a single class (a singleton actually) with three
registering methods and three measure methods. I don't think such a
simple class needs proper separation of concerns, but we can talk
about this in the PR. The registration part could be turned into some
kind of DSL, currently it takes metric name, description and list of
keys which will be part of an instance for those frameworks which do
not support arbitrary amount of key-value pairs.
If there are no objections, I will add settings and better error
handling and file the PR.
--
Later,
Lukas @lzap Zapletal
--
You received this message because you are subscribed to the Google Groups
"foreman-dev" group.
To unsubscribe from this group and stop receiving emails from it, send an
email to foreman-dev+unsubscribe@googlegroups.com.
For more options, visit https://groups.google.com/d/optout.
Thanks for question, this will be completely opt-in via
/etc/foreman/settings.yaml. You can turn off (default behavior when
not set), or on via prometheus, statsd or logging implementation (for
debugging purposes - sends stats to Rails log / production.log).
···
On Mon, Nov 20, 2017 at 4:31 PM, Bryan Kearney <bryan.kearney@gmail.com> wrote:
How would folks disable it opt out of sending this data?
On Nov 20, 2017 9:46 AM, "Lukas Zapletal" <lzap@redhat.com> wrote:
Hey,
on the last demo I presented my proposal for telemetry (it is actually
a separate video). I am looking for non-intrusive approach with broad
integration possibilities:
This was also showed on our demo last week (the same content):
I am starting this thread to gather feedback before I open a PR with
this. Currently the code is mostly in Rails initializer and looks like
this:
# get telemetry singleton instance and setup it
telemetry = Foreman::Telemetry.instance.setup(... some options ...)
# register measurements
telemetry.add_counter(:http_requests, 'A counter of HTTP requests
made', [:controller, :action])
telemetry.add_histogram(:http_request_total_duration, 'Total
duration', [:controller, :action])
telemetry.add_counter(:activerecord_instances, 'Number of instances of
AR models', [:class])
# send measurements from Rails instrumentation or from code base
telemetry.increment_counter(:http_requests, 1, :controller =>
controller, :action => action, :status => status)
telemetry.observe_histogram(:http_request_total_duration, duration,
:controller => controller, :action => action)
The proposed API is a single class (a singleton actually) with three
registering methods and three measure methods. I don't think such a
simple class needs proper separation of concerns, but we can talk
about this in the PR. The registration part could be turned into some
kind of DSL, currently it takes metric name, description and list of
keys which will be part of an instance for those frameworks which do
not support arbitrary amount of key-value pairs.
If there are no objections, I will add settings and better error
handling and file the PR.
--
Later,
Lukas @lzap Zapletal
--
You received this message because you are subscribed to the Google Groups
"foreman-dev" group.
To unsubscribe from this group and stop receiving emails from it, send an
email to foreman-dev+unsubscribe@googlegroups.com.
For more options, visit https://groups.google.com/d/optout.
--
You received this message because you are subscribed to the Google Groups
"foreman-dev" group.
To unsubscribe from this group and stop receiving emails from it, send an
email to foreman-dev+unsubscribe@googlegroups.com.
For more options, visit https://groups.google.com/d/optout.
1. what happened to the PCP approach we talked about in the past?
2. how would you integrate this to sosreport/foreman-debug? I'm thinking of
storing the statsd data locally, collecting them with foreman-debug, and
then, being able to import them later to the prometheus and other tools. Is
this how this could work? Any other options?
3. does every host/runtime needs it's own statsd service, or there would be
one shared process? Asking bith for multi-host and containers use-case
The proposal of the telemetry api itself seems reasonable, let's discuss
that on an actual PR
-- Ivan
···
On Tue, 21 Nov 2017 at 13:59, Lukas Zapletal <lzap@redhat.com> wrote:
Thanks for question, this will be completely opt-in via
/etc/foreman/settings.yaml. You can turn off (default behavior when
not set), or on via prometheus, statsd or logging implementation (for
debugging purposes - sends stats to Rails log / production.log).
On Mon, Nov 20, 2017 at 4:31 PM, Bryan Kearney <bryan.kearney@gmail.com> > wrote:
How would folks disable it opt out of sending this data?
On Nov 20, 2017 9:46 AM, "Lukas Zapletal" <lzap@redhat.com> wrote:
Hey,
on the last demo I presented my proposal for telemetry (it is actually
a separate video). I am looking for non-intrusive approach with broad
integration possibilities:
This was also showed on our demo last week (the same content):
I am starting this thread to gather feedback before I open a PR with
this. Currently the code is mostly in Rails initializer and looks like
this:
# get telemetry singleton instance and setup it
telemetry = Foreman::Telemetry.instance.setup(... some options ...)
# register measurements
telemetry.add_counter(:http_requests, 'A counter of HTTP requests
made', [:controller, :action])
telemetry.add_histogram(:http_request_total_duration, 'Total
duration', [:controller, :action])
telemetry.add_counter(:activerecord_instances, 'Number of instances of
AR models', [:class])
# send measurements from Rails instrumentation or from code base
telemetry.increment_counter(:http_requests, 1, :controller =>
controller, :action => action, :status => status)
telemetry.observe_histogram(:http_request_total_duration, duration,
:controller => controller, :action => action)
The proposed API is a single class (a singleton actually) with three
registering methods and three measure methods. I don't think such a
simple class needs proper separation of concerns, but we can talk
about this in the PR. The registration part could be turned into some
kind of DSL, currently it takes metric name, description and list of
keys which will be part of an instance for those frameworks which do
not support arbitrary amount of key-value pairs.
If there are no objections, I will add settings and better error
handling and file the PR.
--
Later,
Lukas @lzap Zapletal
--
You received this message because you are subscribed to the Google
Groups
"foreman-dev" group.
To unsubscribe from this group and stop receiving emails from it, send
an
email to foreman-dev+unsubscribe@googlegroups.com.
For more options, visit https://groups.google.com/d/optout.
--
You received this message because you are subscribed to the Google Groups
"foreman-dev" group.
To unsubscribe from this group and stop receiving emails from it, send an
email to foreman-dev+unsubscribe@googlegroups.com.
For more options, visit https://groups.google.com/d/optout.
--
Later,
Lukas @lzap Zapletal
--
You received this message because you are subscribed to the Google Groups
"foreman-dev" group.
To unsubscribe from this group and stop receiving emails from it, send an
email to foreman-dev+unsubscribe@googlegroups.com.
For more options, visit https://groups.google.com/d/optout.
1. what happened to the PCP approach we talked about in the past?
Thats going in parallel, PCP is just a monitoring framework you can
integrate with instrumentation data just like any other.
2. how would you integrate this to sosreport/foreman-debug? I'm thinking of
storing the statsd data locally, collecting them with foreman-debug, and
then, being able to import them later to the prometheus and other tools. Is
this how this could work? Any other options?
This is my ultimate goal to have working PCP deployment including
telemetry data and archives could be collected by foreman-debug, they
are pretty small (few MBs per day).
3. does every host/runtime needs it's own statsd service, or there would be
one shared process? Asking bith for multi-host and containers use-case
It is up to you if you want one statsd service per guest/container,
host or subnet. Prometheus endpoint will not require any external
daemon once sharing metrics is merged into upstream. For this reason,
statsd will server as a temporary solution and alternative for the
future.
The proposal of the telemetry api itself seems reasonable, let's discuss
that on an actual PR
Openshift uses Prometheus[1] which seems very similar and compatible with
your ideas. Is that something you've looked at already? If/when foreman is
containerized and perhaps run under kubernetes your work could be very
useful as well.
On Fri, Nov 24, 2017 at 12:54 PM, Lukas Zapletal <lzap@redhat.com> wrote:
> 1. what happened to the PCP approach we talked about in the past?
Thats going in parallel, PCP is just a monitoring framework you can
integrate with instrumentation data just like any other.
> 2. how would you integrate this to sosreport/foreman-debug? I'm thinking
of
> storing the statsd data locally, collecting them with foreman-debug, and
> then, being able to import them later to the prometheus and other tools.
Is
> this how this could work? Any other options?
This is my ultimate goal to have working PCP deployment including
telemetry data and archives could be collected by foreman-debug, they
are pretty small (few MBs per day).
> 3. does every host/runtime needs it's own statsd service, or there would
be
> one shared process? Asking bith for multi-host and containers use-case
It is up to you if you want one statsd service per guest/container,
host or subnet. Prometheus endpoint will not require any external
daemon once sharing metrics is merged into upstream. For this reason,
statsd will server as a temporary solution and alternative for the
future.
> The proposal of the telemetry api itself seems reasonable, let's discuss
> that on an actual PR
Ooops! I should have watched your video first. Watching it now. "Proposal
to integrate Prometheus and Statsd instrumentation libraries into Foreman
..."
Openshift uses Prometheus[1] which seems very similar and compatible with
your ideas. Is that something you've looked at already? If/when foreman is
containerized and perhaps run under kubernetes your work could be very
useful as well.
On Fri, Nov 24, 2017 at 12:54 PM, Lukas Zapletal <lzap@redhat.com> wrote:
> 1. what happened to the PCP approach we talked about in the past?
Thats going in parallel, PCP is just a monitoring framework you can
integrate with instrumentation data just like any other.
> 2. how would you integrate this to sosreport/foreman-debug? I'm
thinking of
> storing the statsd data locally, collecting them with foreman-debug, and
> then, being able to import them later to the prometheus and other
tools. Is
> this how this could work? Any other options?
This is my ultimate goal to have working PCP deployment including
telemetry data and archives could be collected by foreman-debug, they
are pretty small (few MBs per day).
> 3. does every host/runtime needs it's own statsd service, or there
would be
> one shared process? Asking bith for multi-host and containers use-case
It is up to you if you want one statsd service per guest/container,
host or subnet. Prometheus endpoint will not require any external
daemon once sharing metrics is merged into upstream. For this reason,
statsd will server as a temporary solution and alternative for the
future.
> The proposal of the telemetry api itself seems reasonable, let's discuss
> that on an actual PR
Ooops! I should have watched your video first. Watching it now. "Proposal
to integrate Prometheus and Statsd instrumentation libraries into Foreman
..."
Openshift uses Prometheus[1] which seems very similar and compatible with
your ideas. Is that something you've looked at already? If/when foreman is
containerized and perhaps run under kubernetes your work could be very
useful as well.
On Fri, Nov 24, 2017 at 12:54 PM, Lukas Zapletal <lzap@redhat.com> wrote:
> 1. what happened to the PCP approach we talked about in the past?
Thats going in parallel, PCP is just a monitoring framework you can
integrate with instrumentation data just like any other.
> 2. how would you integrate this to sosreport/foreman-debug? I'm
> thinking of
> storing the statsd data locally, collecting them with foreman-debug,
> and
> then, being able to import them later to the prometheus and other
> tools. Is
> this how this could work? Any other options?
This is my ultimate goal to have working PCP deployment including
telemetry data and archives could be collected by foreman-debug, they
are pretty small (few MBs per day).
> 3. does every host/runtime needs it's own statsd service, or there
> would be
> one shared process? Asking bith for multi-host and containers use-case
It is up to you if you want one statsd service per guest/container,
host or subnet. Prometheus endpoint will not require any external
daemon once sharing metrics is merged into upstream. For this reason,
statsd will server as a temporary solution and alternative for the
future.
> The proposal of the telemetry api itself seems reasonable, let's
> discuss
> that on an actual PR
Don't you have a docker container somewhere all setup?
···
On Thu, Dec 14, 2017 at 5:28 PM, Lukas Zapletal <lzap@redhat.com> wrote:
Thanks for feedback!
On Thu, Dec 14, 2017 at 3:52 PM, Tom McKay <thomasmckay@redhat.com> wrote:
> Ooops! I should have watched your video first. Watching it now.
"Proposal
> to integrate Prometheus and Statsd instrumentation libraries into Foreman
> ..."
>
> On Thu, Dec 14, 2017 at 9:26 AM, Tom McKay <thomasmckay@redhat.com> > wrote:
>>
>> Openshift uses Prometheus[1] which seems very similar and compatible
with
>> your ideas. Is that something you've looked at already? If/when foreman
is
>> containerized and perhaps run under kubernetes your work could be very
>> useful as well.
>>
>> https://blog.openshift.com/tag/prometheus/
>>
>>
>>
>> On Fri, Nov 24, 2017 at 12:54 PM, Lukas Zapletal <lzap@redhat.com> > wrote:
>>>
>>> > 1. what happened to the PCP approach we talked about in the past?
>>>
>>> Thats going in parallel, PCP is just a monitoring framework you can
>>> integrate with instrumentation data just like any other.
>>>
>>> > 2. how would you integrate this to sosreport/foreman-debug? I'm
>>> > thinking of
>>> > storing the statsd data locally, collecting them with foreman-debug,
>>> > and
>>> > then, being able to import them later to the prometheus and other
>>> > tools. Is
>>> > this how this could work? Any other options?
>>>
>>> This is my ultimate goal to have working PCP deployment including
>>> telemetry data and archives could be collected by foreman-debug, they
>>> are pretty small (few MBs per day).
>>>
>>> > 3. does every host/runtime needs it's own statsd service, or there
>>> > would be
>>> > one shared process? Asking bith for multi-host and containers
use-case
>>>
>>> It is up to you if you want one statsd service per guest/container,
>>> host or subnet. Prometheus endpoint will not require any external
>>> daemon once sharing metrics is merged into upstream. For this reason,
>>> statsd will server as a temporary solution and alternative for the
>>> future.
>>>
>>> > The proposal of the telemetry api itself seems reasonable, let's
>>> > discuss
>>> > that on an actual PR
>>>
>>> Thanks, I hope to finish it this year.
>>>
>>> --
>>> Later,
>>> Lukas @lzap Zapletal
>>>
>>> --
>>> You received this message because you are subscribed to the Google
Groups
>>> "foreman-dev" group.
>>> To unsubscribe from this group and stop receiving emails from it, send
an
>>> email to foreman-dev+unsubscribe@googlegroups.com.
>>> For more options, visit https://groups.google.com/d/optout.
>>
>>
>
> --
> You received this message because you are subscribed to the Google Groups
> "foreman-dev" group.
> To unsubscribe from this group and stop receiving emails from it, send an
> email to foreman-dev+unsubscribe@googlegroups.com.
> For more options, visit https://groups.google.com/d/optout.
Run prometheus container locally
$ docker run -d -p 9090:9090 registry.access.redhat.com/openshift3/prometheus
The prometheus binary is set as the entrypoint for the container
$ docker run -d prom/prometheus --help
(Images also available on docker hub prom/prometheus)
Don't you have a docker container somewhere all setup?
Thanks for feedback!
On Thu, Dec 14, 2017 at 3:52 PM, Tom McKay <thomasmckay@redhat.com> >> wrote:
> Ooops! I should have watched your video first. Watching it now.
"Proposal
> to integrate Prometheus and Statsd instrumentation libraries into
Foreman
> ..."
>
> On Thu, Dec 14, 2017 at 9:26 AM, Tom McKay <thomasmckay@redhat.com> >> wrote:
>>
>> Openshift uses Prometheus[1] which seems very similar and compatible
with
>> your ideas. Is that something you've looked at already? If/when
foreman is
>> containerized and perhaps run under kubernetes your work could be very
>> useful as well.
>>
>> https://blog.openshift.com/tag/prometheus/
>>
>>
>>
>> On Fri, Nov 24, 2017 at 12:54 PM, Lukas Zapletal <lzap@redhat.com> >> wrote:
>>>
>>> > 1. what happened to the PCP approach we talked about in the past?
>>>
>>> Thats going in parallel, PCP is just a monitoring framework you can
>>> integrate with instrumentation data just like any other.
>>>
>>> > 2. how would you integrate this to sosreport/foreman-debug? I'm
>>> > thinking of
>>> > storing the statsd data locally, collecting them with foreman-debug,
>>> > and
>>> > then, being able to import them later to the prometheus and other
>>> > tools. Is
>>> > this how this could work? Any other options?
>>>
>>> This is my ultimate goal to have working PCP deployment including
>>> telemetry data and archives could be collected by foreman-debug, they
>>> are pretty small (few MBs per day).
>>>
>>> > 3. does every host/runtime needs it's own statsd service, or there
>>> > would be
>>> > one shared process? Asking bith for multi-host and containers
use-case
>>>
>>> It is up to you if you want one statsd service per guest/container,
>>> host or subnet. Prometheus endpoint will not require any external
>>> daemon once sharing metrics is merged into upstream. For this reason,
>>> statsd will server as a temporary solution and alternative for the
>>> future.
>>>
>>> > The proposal of the telemetry api itself seems reasonable, let's
>>> > discuss
>>> > that on an actual PR
>>>
>>> Thanks, I hope to finish it this year.
>>>
>>> --
>>> Later,
>>> Lukas @lzap Zapletal
>>>
>>> --
>>> You received this message because you are subscribed to the Google
Groups
>>> "foreman-dev" group.
>>> To unsubscribe from this group and stop receiving emails from it,
send an
>>> email to foreman-dev+unsubscribe@googlegroups.com.
>>> For more options, visit https://groups.google.com/d/optout.
>>
>>
>
> --
> You received this message because you are subscribed to the Google
Groups
> "foreman-dev" group.
> To unsubscribe from this group and stop receiving emails from it, send
an
> email to foreman-dev+unsubscribe@googlegroups.com.
> For more options, visit https://groups.google.com/d/optout.
I recorded short demo how to set it up with Prometheus via statsd:
···
On Mon, Nov 20, 2017 at 3:46 PM, Lukas Zapletal <lzap@redhat.com> wrote:
Hey,
on the last demo I presented my proposal for telemetry (it is actually
a separate video). I am looking for non-intrusive approach with broad
integration possibilities:
I am starting this thread to gather feedback before I open a PR with
this. Currently the code is mostly in Rails initializer and looks like
this:
# get telemetry singleton instance and setup it
telemetry = Foreman::Telemetry.instance.setup(... some options ...)
# register measurements
telemetry.add_counter(:http_requests, 'A counter of HTTP requests
made', [:controller, :action])
telemetry.add_histogram(:http_request_total_duration, 'Total
duration', [:controller, :action])
telemetry.add_counter(:activerecord_instances, 'Number of instances of
AR models', [:class])
# send measurements from Rails instrumentation or from code base
telemetry.increment_counter(:http_requests, 1, :controller =>
controller, :action => action, :status => status)
telemetry.observe_histogram(:http_request_total_duration, duration,
:controller => controller, :action => action)
The proposed API is a single class (a singleton actually) with three
registering methods and three measure methods. I don't think such a
simple class needs proper separation of concerns, but we can talk
about this in the PR. The registration part could be turned into some
kind of DSL, currently it takes metric name, description and list of
keys which will be part of an instance for those frameworks which do
not support arbitrary amount of key-value pairs.
If there are no objections, I will add settings and better error
handling and file the PR.
Hi, Lukas! One ask from user perspective - based on my experience of graphite plugin (sending its metrics to locally-running GitHub - prometheus/graphite_exporter: Server that accepts metrics via the Graphite protocol and exports them as Prometheus metrics for subsequent scrapping by Prometheus - very similar to your proposal, just Prometheus is running on a separate server in my setup so it can scrape all of my Foreman instances and then visualized by Grafana). While collecting all Ruby or Foreman controller metrics is great, it is really hard to translate into easy-understadable dashboards - for example, say, if DB connection is spiking up, it results in spiking for some index-generation, but it is not clear what Foreman functional areas are really affected by this. It would be great if there were more metrics exposed per major Foreman function, similar to current dashboards in UI - # puppet runs, hosts built or discovered, tasks, etc.
With these metrics available, it would be much easier to make sense of underlying Ruby metrics, IMHO. One can see rolled-up graphs and, in case, of abnormalities correlate that to ruby calls, db latency, etc.
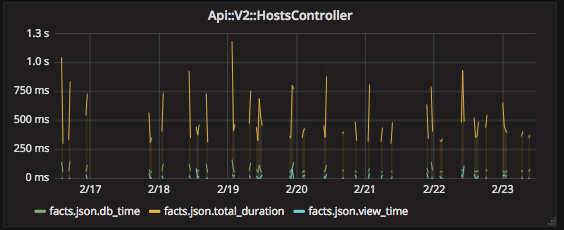
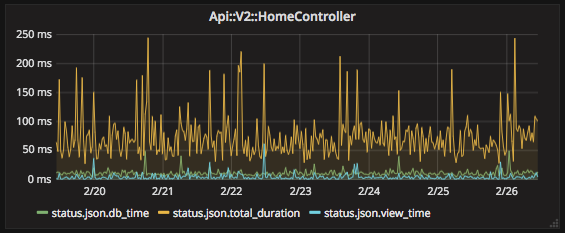
Another thing I noticed with current graphite plugin is that Ruby metrics are generated only when a particular function is executed resulting in “torn” or spotty graphs:
Not sure what could done about that though. Hoping you may have some ideas on how to make this better looking.
Hey, thanks for trying that out. The initial patch only added the framework and few metrics, I want to carry on and add more of these. I am gonna start thread about what things you would like to see to be measured here on the list, looks like you are faster
So first of all, the most important metric for now is Rails controller duration, this is exported per individual controller and action which gives you great detail of what exactly is slow and you can easily tell which code is causing it. I understand that from higher-lever perspective this can be less useful. There are two options - first you create a query where you aggreggate numbers from various sources (controllers/actions) into one number - let’s say fact import, and present that as one graph. You can do this with all good monitoring applications, including Prometheus or Graphite. We can share dashboards here or in git repo so work don’t get lost. Second option, which I don’t prefer, is to send extra aggregated data per logical domain, that’s basically copying of data. For not I suggest to aggregate all durations and watch for spikes there, the same for object allocations.
The graph you see looks bad, do you use statsd exporter or do you directly connect to Prometheus? Because the latter won’t work with multi-process server (Passenger for example). How do you see the data when you try to scrape them with Prometheus directly? It works for me.
Sorry, I wasn’t clear enough - I did not try your PR yet, just using a graphite plugin with my 1.14 instances. So, exporting directly to Prometheus is simply impossible and I have to use statsd_exporter to accept metrics coming from local Foreman instance and then scrape that exporter from remote Prometheus server (to allow for a central place where dashboards are generated or collected data used otherwise).
I agree with you that combining Rails to aggregate events into a single graph would certainly work. The only issue is that creating those would require a very deep understanding of all underlying pieces at play and that is something that regular users would not necessarily exposed to. Sharing such dashboards would be absolutely great.
Also, are there any plans to add telemetry to Foreman SmartProxy? Would love to have that.
As for the broken graph - the point I was trying to make there is that if a particular controller function is not constantly used, the data provided to statsd is only when that particular function is called thus resulting in broken graphs as there’s simply no data for Grafana to plot against. The other more frequently used functions, graphed out perfectly fine, so I don’t believe this is statsd issue. For example:
This is really smaller of the issue, I guess. Just wanted to point that out.
Thanks!
I would not say not possible, there are some experimental patches for ruby prometheus client to get that working if you want to try it. Hotfix the gem and you can collect the data without statsd if you want to. Hopefully we will get that some day.
Aggregating data is monitoring stack job, not monitored application. I don’t think this needs “deep understanding” of anything, I scheduled a deep dive on this topic where I will show what you can do with this and share important Prometheus queries you want to use. Join and discuss, I would love to hear direct feedback: Foreman :: Foreman Events and https://www.youtube.com/watch?v=QoJ-r8YfWEI
Yes, this is my ultimate goal. But documentation and demo first, more metrics and then this is on my list.
This is nothing wrong with statsd (which is just a protocol), but setting of your aggregator. Each statsd aggregator can be configured to “remember” last values forever, or for some time. AFAIK statsd_exporter does remember forever and there is no configuration option for that, not sure why you see those gaps. Anyway, these controllers are not interesting (if you visit them once a day), if you need to see a graph, change the rendering to continuous type or similar. Or you can increase window from which you calculate means from 5 minutes to hours…
The telemetry deep dive is not happening tomorrow. I’d love to say it’s calendar conflict or another more important event, the truth is I messed up planning completely and I am not working tomorrow. We will schedule new one, sorry about that!

 Watching it now. "Proposal