after discussion with @ekohl this could be an issue new foreman_puppet plugin that doesn’t add the column and maybe that was missed in the extraction from core.
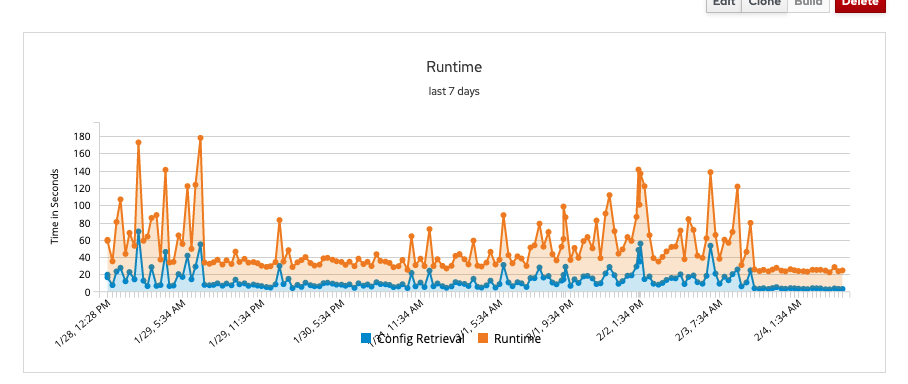
Having the Runtime widget (Config Retrieval and Runtime) overview has proven to be really helpful with tuning our installation properly for performance across a large installations, and if it’s not too heavy to keep such a widget on the new host detail page (or if there’s somewhere else to retrieve an average / overview of such stats) it would still prove to be extremely useful! Thanks!
Thanks for the feedback, I think the plan is to keep this chart based on the configuration reports in the respective tabs. FYI @lzap@MariSvirik@amirfefer
The chart will definitely not be with Foreman 3.2 but we would like to get it back. It was quite heavy on resources thos as it needs to load 7 days of reports, parse all metadata (YAML) and draw the stuff. In the new design, this is not changing - it just needs to load whole report body (JSON).
Having said that, this should have been using Rails Cache from the day one, so at least we can ensure that once this is fetched once in 30 minutes (the puppet interval), we can grab it from cache quickly.
Thanks @James_Shewey, could you please describe the flow in more details? Do you go to the templates tab and “Review” the e.g. provisioning template? Perhaps the list of associated templates would be a good addition to the new Details tab.
@Marek_Hulan - Yes that is correct. From host Host Overview, I then click the Legacy UI option, then click the templates tab and then click on the upside-down carat (^) symbol or down arrow and right click on “review” and open in new tab (Loading the page while losing the navigation interface has always felt clunky to me and that was my workaround).
It would definitely be great to have that on the details page. I don’t care if it gets buried somewhere as long as I will still be able to get to it when the old UI goes away.
New UI has a great potential. If it will be possible to add some tiles with info from old hosts page, like HW, OS, Facts… all on tiles which you will be able to enable/disable and move as you like.
Totally, there’s a PR that adds the details tab, which should be full of information. They can be collapsed (and such preference will be stored for the user) so one could tailor, what all is relevant.
I would like to see the old button to “schedule remote job” on the host.
Now I have to go to “Monitor → Jobs”.
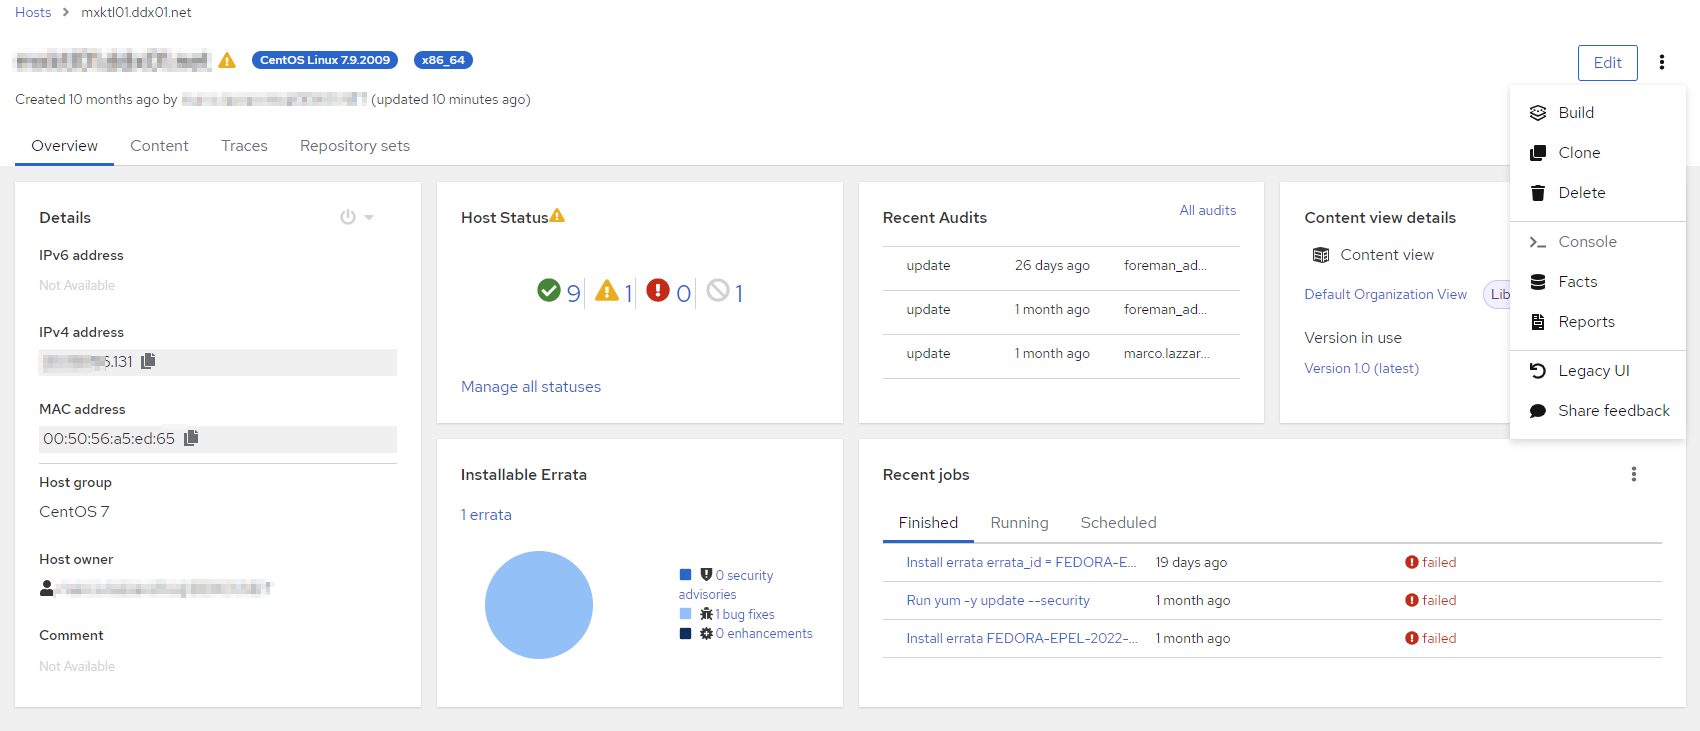
And what is the “>_ console" button”? Mine is disabled.
IIRC that’s access to a serial line-like console for machines which support it. It is quite possible that previously it was hidden if unavailable, but now it is shown, but disabled.
Not sure if anyone has mentioned this yet, but the Web Console button is missing from the new UI, or I am at least not finding it. Need to revert to legacy/old ui to get to it.
My org recently upgraded to 3.2, here’s some of my feedback:
Our compliance requires requires rebuilding of hosts every few months, so easy access to the build button on the host page has been valuable our org. Having it or at least some indicator of build mode status visible without a dropdown would be nice.
The “Templates” tab from the old view is very useful for troubleshooting; that is something I regularly have to flip back to the old view for.
The new “Recent audits” tile is pretty nice!
Could “Host Group” under the “Details” tile be made a link to the host group again? This is important considering the full path of the host group is not shown anymore and two different nested host groups could have the same name.
Gotcha, now it’s hidden in the kebab menu. I think we will revisit this when the kebab menu is full of actions. It may be good to add a Provisioning overview card so it’s immediatelly clear, what’s the status of it. I suppose that would only be displayed if the Host has build status defined.
For the templates, we’re tracking the following stories in upcoming version or two.
As a user I’d like to see all assigned provisioning templates for the Host in the Details tab
As a user, I can review the assigned provisioning template I see in the Details tab, the result should not force me to leave the page.