Even almost empty foreman feels slow and sluggish

Just a general question: is it normal that foreman is “really slow”? I mean the HW I run it on is quite old (Xeon X5550 @ 2.67GHz), but still, I have given it 20 GB RAM and 6 cores…

There’s almost nothing in it yet (one hypervisor and 3 to 5 VMs).

After VM boot, it takes several minutes before the foreman web page becomes responsive; when trying to reboot the VM, stopping foreman seems to take 1-2 minutes.

Running foreman-installer to add the plugin-remote-execution stuff took several minutes as well.
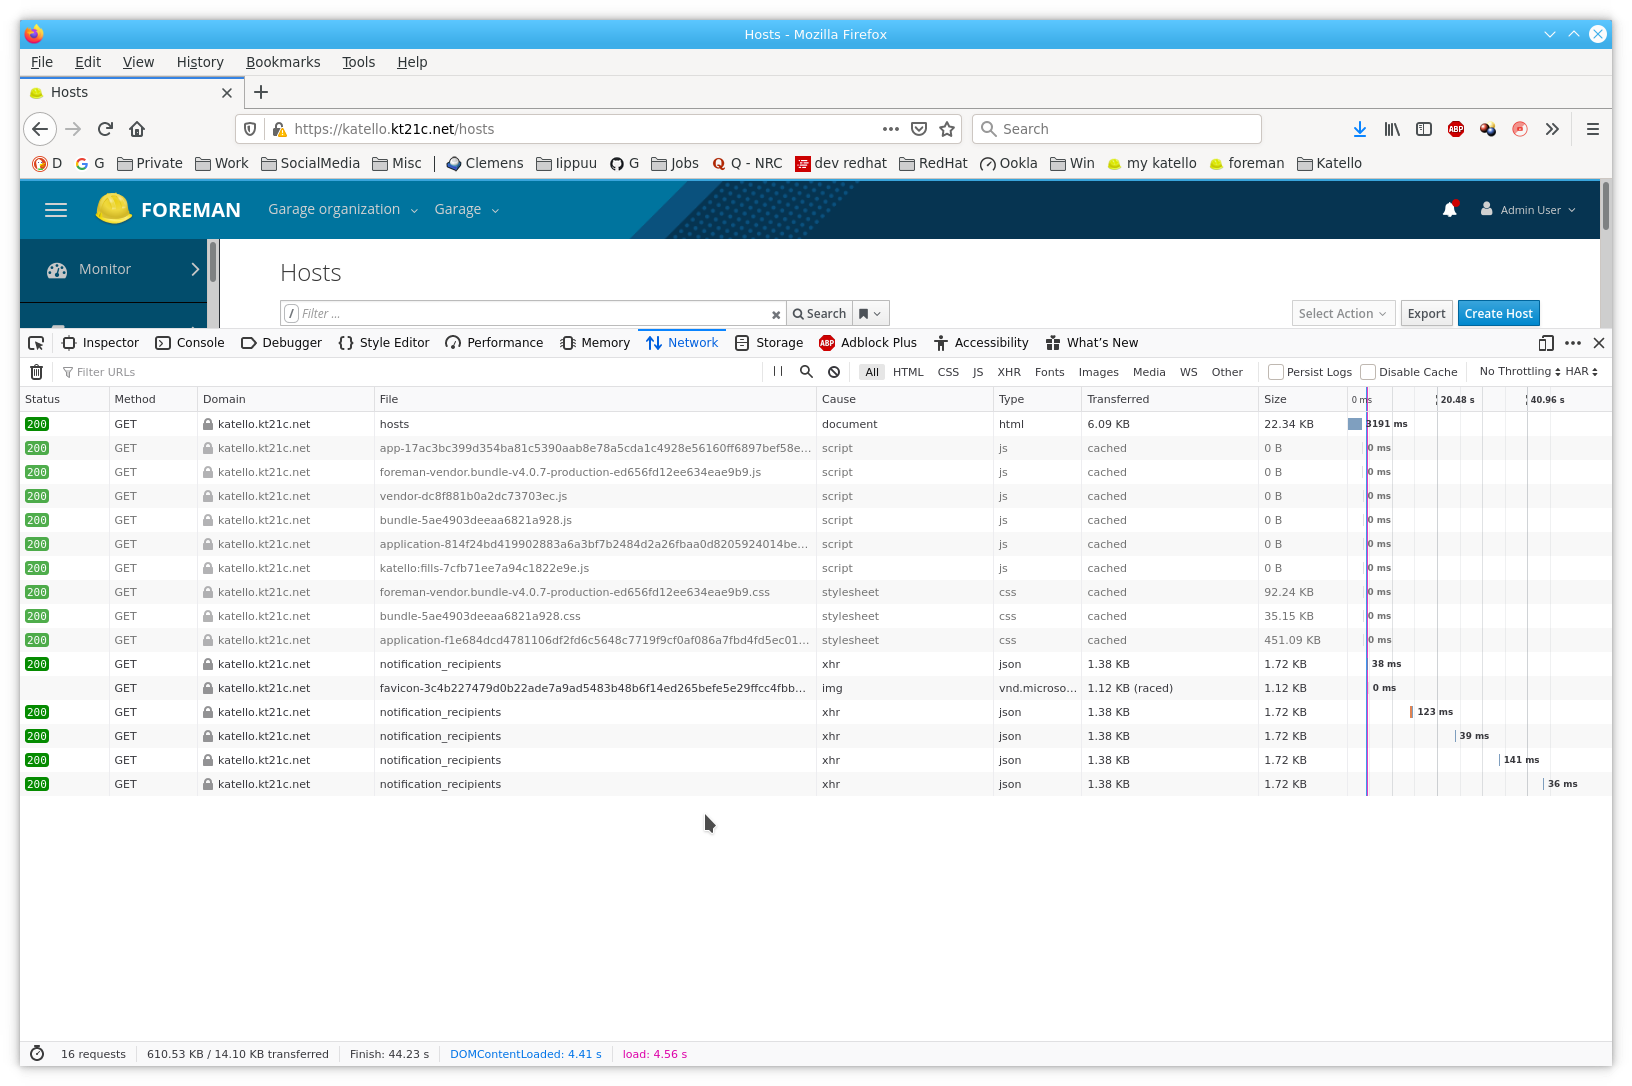
Navigating inside foreman, it might take several seconds before the new page displays :frowning:
For Partitition Tables and Provisioning Templates, 2-3 seconds, for “All Hosts” 6 seconds. (The “is host on or not display” I have already disabled).

foreman-maintain service restart takes almost two minutes:

[root@katello ~]# time  foreman-maintain  service restart
Running Restart Services
================================================================================
Check if command is run as root user:                                 [OK]
--------------------------------------------------------------------------------
Restart applicable services: 

Stopping the following service(s):
rh-mongodb34-mongod, rh-redis5-redis, postgresql, pulpcore-api, pulpcore-content, pulpcore-resource-manager, qdrouterd, qpidd, rh-redis5-redis, squid, pulp_celerybeat, pulp_resource_manager, pulp_streamer, pulp_workers, pulpcore-worker@*, smart_proxy_dynflow_core, tomcat, dynflow-sidekiq@orchestrator, httpd, puppetserver, dynflow-sidekiq@worker, dynflow-sidekiq@worker-hosts-queue, foreman-proxy
/ All services stopped                                                          

Starting the following service(s):
rh-mongodb34-mongod, rh-redis5-redis, postgresql, pulpcore-api, pulpcore-content, pulpcore-resource-manager, qdrouterd, qpidd, rh-redis5-redis, squid, pulp_celerybeat, pulp_resource_manager, pulp_streamer, pulp_workers, pulpcore-worker@*, smart_proxy_dynflow_core, tomcat, dynflow-sidekiq@orchestrator, httpd, puppetserver, dynflow-sidekiq@worker, dynflow-sidekiq@worker-hosts-queue, foreman-proxy
\ All services started                                                [OK]      
--------------------------------------------------------------------------------


real    1m55.697s
user    0m7.871s
sys     0m3.729s
[root@katello ~]# 

Is ruby on rails (celery?) generally that slow, or is there perhaps some problem with the setup or my VM?

top and sar do not show significant load; looks like it was all the time only one single ruby process 99% CPU…

It would be useful to know which version you’re running. From the presence of pulpcore I’m guessing Katello 3.15.

That sounds very slow. Can you share the Network diagram from your browser? I wonder how long the various resources take.

Part of the problem here is foreman-maintain and its implementation is sequential and doesn’t utilize parallelization that systemd offers. It also stops all services and then starts them again instead of using systemctl restart. I never understood the benefit of it other than providing a list of services. On a VM you could even try rebooting the system - the parallel stop + start might mean it’s just as fast or faster. On bare metal the bios + raid controller usually take ages.

Yes, foreman 2.0 and katello 3.15, as I wrote elsewhere.

I don’t know what you mean with “Network diagram from your browser”.

On a VM you could even try rebooting the system

As said, it feels this also affects general shutdown. Like, some other VM which runs only dhcp and bind, or postfix and dovecot, one says in libvirt/virt-manager “shutdown” and it’s down within 5-10 seconds.

The katello VM, possibly open ssh sessions are killed immediately, but on console for a long time happens nothing, before it finally goes off.

I had similar problems with serviio media server, that the java process of that took ages to start (1-2 minutes) and stop. At least in one case it had to do with Java trying to “get the own IP address” or something, and since I did not have any DNS setup at that time, that call was hanging 30 or 60 secs before it timed out.

On bare metal the bios + raid controller usually take ages.

Oh yeah; I know that feeling. Truer words were rarely spoken :slight_smile:

Ah, I think you might mean this:

This was for the “All hosts” request.

And another interesting effect is, the entries in the table below (all the lines with 200 in beginning and some ms value in the end), all of them appear relatievly quickly, but it takes a lot longer until browser redraws the actual page ?
This is a Dell E6440, RAM should not be the problem, it still shows 9 GB as even totally free.

Can a 3 monitor setup (builtin + 2 external screens via the docking station) cause such slow graphic update? I will try that with just laptop screen for comparison :slight_smile:

hm, ok. With no other applications open/running at all, all plugins disabled and only laptop screen, it feels a bit less sluggish. Between 1 and 2 seconds for most pages. That kind of delay is understandable when it has to fetch a couple of things sequentially from the server…

So it’s probably several things causing this overall “not as snappy as I’d like it to be” :slight_smile:

So my theory is that the time it takes increases exponentially with the cost. The more expensive, the slower it is.

That is slow. I’m not sure what makes it that slow

No, this is purely the server response. I’d be more looking at a slow webserver/database or something like that.

This is a very interesting problem. The network diagram shows that the load time of the hosts page takes very long.
Do you mind setting the log level of foreman to debug (in /etc/foreman/settings.yaml) and pasting the particular request here? That should give use some more info to what is happening.
Are you using an admin user or do you have a user with limited permissions?

If you have - by any chance - access to an ElasticAPM endpoint, we have a plugin that enabled APM logging. This is perfect du debug performance issues.

From my testing of APM, I would guess the Power management operations so detecting powered on or off state takes so long because off is recognized in most cases via time out of this operation.

I am/was logged in as admin user. Changed the settings.yaml and right now restarting foreman.

Below are (I think) relevant lines from log:

log-excerpt.log (9.5 KB)

detecting power state happens after the pager is loaded (separate browser
call per host to not block the page from loading)

Shouldn’t this setting below prevent those delays?

Well, I don’t have any ElasticSearch thingy yet. I’ve been “dreaming” of setting up my own small kubernetes (or some other environment to run some containers) but there was never enough “need” to make it happen :slight_smile:

Looks like the world is going more and more to containers, less full-blown VMs like I am mostly used to. So I feel I should “invest” a bit more time into that, to remain employable…

Do you have any recommendation/suggestion what infra would be best to run ElasticSearch? OpenShift, minicube, kubernetes, something else … ?

As said, I’ve three blades, each with 16 cores and 48 or 96 GB of RAM, so resources are probably not something to worry about… fuji1 (more disk, less RAM) I plan to use for bacula, the 3rd is running katello and some test VMs, the 2nd is still totally empty. (There I did the bare-metal PXE installation some days ago). So that has a virgin minimal CentOS right now.

ah, ok, one can also install it “just like that”. In our company they talked about ElasticSearch (and Kibana, and …) always in Container context, that’s why I asked above about “which infra”. I’ll give it a try to just install it in a VM.

hm, ok … so, now I have installed an Elasticsearch-oss 7.7.1. When trying to "how do I configure foreman to send data to it, I stumbled over this (which was made/says it should be used with foreman 1.22):

which says:

ElasticSearch version 5.x is required because Elastic version 6.x does not work with rsyslog. For more information on the issue, see: BZ#1600171. Also the operating system was Red Hat Enterprise Linux 7.6.

And in that BZ ticket one reads, that fixing this was postponed to RHEL 8.

So… is above still correct, shall I install an Elasticsearch 5.x instead? Or will 7.x do?

Or do you have pointer at hand to instructions how to configure foreman 2.0 to send data to Elasticsearch 7.7.1. ?

[root@elasticsearch ~]# yum list installed "elastic*" "kibana*"
Loaded plugins: fastestmirror
Loading mirror speeds from cached hostfile
 * base: mirror.hosthink.net
 * epel: mirror.nsc.liu.se
 * extras: mirror.hosthink.net
 * updates: centosv8.centos.org
Installed Packages
elasticsearch-oss.x86_64                           7.7.1-1                            @elasticsearch-7.x
kibana-oss.x86_64                                  7.7.1-1                            @elasticsearch-7.x
[root@elasticsearch ~]#

Upload template from the server to ElasticSearch server. Be sure to pick the correct version as more than one JSON templates might have been generated. For ElasticSearch 5.x choose JSON index template version 5.5.2.

Yes, and the git checkout only has that 5,5,2 as well.

ok, so I would need a template for version 7.7. Is that perhaps somewhere delivered with foreman ?
Or do you have one from your own test environments?

Meanwhile I’ll install an Elastic 5.5 version into another VM. I have some handy tool nowadays which makes it very easy to create a new VM :slight_smile:

Success! (I think).

So I have now an ElasticSearch 5.5. instance with Kibana, and get some log entries from foreman/katello sent to it.

1 Like

Great. What I actually meant was this plugin:

The tool allows you to see all requests and see the time the processing took down to the sql statement level.

The logs you posted actually show quite a fast rendering time. I don’t get where the time is lost.

Before you start digging in the UI, just to make things clear: Foreman (with Katello and other plugins) can be quite demanding deployment. Make sure you meet the requirements, 16GB RAM is a must. Once the VM starts swapping, everything is sluggish and slow. Foreman is not monolithic app, it’s a composition of several of open source projects written in multiple languages, stack, libraries therefore lots of things are duplicated. It is the price we need to pay in order to use the best components out there and not reinventing wheels.

2 Likes