Hi everyboy,
we’ve build Foreman 2.0.0 from source and run it with puma + apache reverse proxy on SLES12 SP5 (ruby2.5 and nodejs10/npm10).
All our servers have 4cpus and 10G memory. Puma is configured to use 2 Workers with 0,16 threads. “preload_app!” is actived.
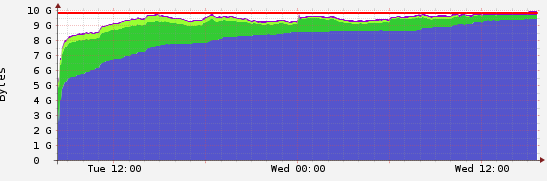
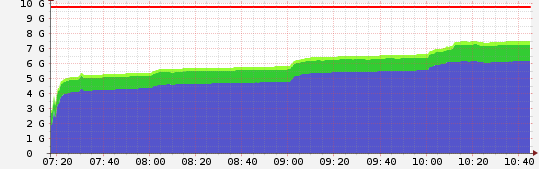
A typical memory consumption looks like:
Is this a normal behaviour?
If you also need further data, please let me know.
I started to look at the same thing but I haven’t got around to graphing it.
Can you take a look at which services are taking up the memory? You can use systemd for this by setting DefaultMemoryAccounting=yes in /etc/systemd/system.conf. Note that if it was false, a service needs to be restarted before it starts to measure it.
Ok, I had to adjust the parameter DefaultMemoryAccounting to yes and restart the services. We have to wait i little bit :/.
Since we build foreman from source, we did not use dynflow-* yet. postgres and the foreman-proxy installed on different server. Foreman and apache are the only services run on this server.
can you pull the same graph but per service? I am particularly interested in foreman (puma) and dynflow (sidekiq).
Compared to what we had previously (passenger), there is one big difference in your setup. We had a single thread per passenger process, by default our installer configured 2-N number of concurrent passenger workers depending on number of cores IIRC. That might be as low as 4-8 in your case.
What I see now is that you have 2 processes with 32 threads in total. A thread is lightwight compared to a process, however there is some amount of memory resources that are still significant - stack frame for example and thread locals.
I’d not expect it to be that big tho. Therefore, once you get those graphs I’d be interested in correlating those with a setup where you set 2 workers 8 threads per worker just to compare this with the current configuration.
Also, let’s focus on dynflow as well - these are now three processes and I think they can also contribute to the total memory consumption. Graph those as well.
Then try configurations with 1 worker and 1, 8, 16 threads to correlate how it’s groing. IMHO 16 is too many for Ruby with GIL, I haven’t tested but I expect the sweet spot somewhere between 3 - 10 threads.
Or you can use any Ruby memory analyzer to see object allocations, advantage of the tracing is that it’s quite effective and does not slow down your deployment too much.
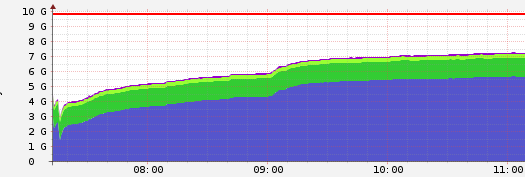
ok, i started to use the default configuration from the puppet modul for foreman (workers=0, threads_min=0, threads_max=16)
in parallel i try different puma configurations (workers, threads_min, threads_max). it seems that these have an effect on memory consumption.
my experience so far:
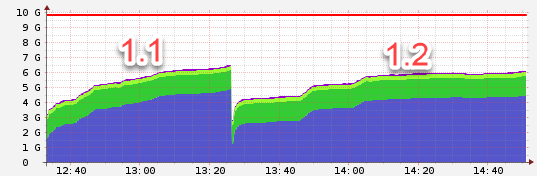
Nodes 1:
1.1 used the defaults, 1.2 worker:2, threads_min: 8, threads_max:16
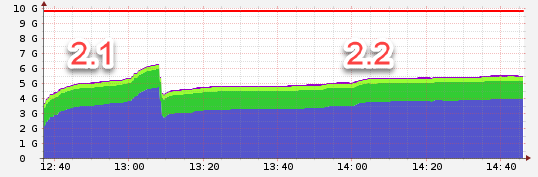
Node 2:
2.1 used the defaults, 2.2 worker: 4, threads_min: 4, threads_max: 8
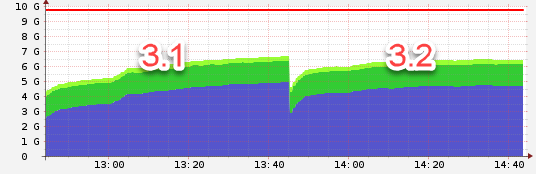
Node 3:
3.1 used the defaults, 3.2 worker: 4, threads_min: 8, threads_max: 16
all have in common that the threads_min is configured to != 0. i will keep watching the different setups.
No, we really have no plugins activated or installed.
Yes, i can do that. Our logging type was set to syslog + json, which results in many script errors. I changed the settings and now have to wait until there are some more log entries.
First, performance. We have heard that 1.24/2.0 do not perform ENC well, that’s 2/3 of your time spent. I’ve made a patch for 2.1 which is relatively slow and shows good improvements there on my instance, your milage may very depending on what do you have in your database, but try to apply this if this helps:
Now, to the memory. Our experience is that a worker process with some plugins installed including Katello can max out at 2 GB on heavy deployments. This is where you should target a auto restart. This brings a question, @ekohl do we have an automatic worker restart bound to some memory in the new puma deployment? This was one of the passenger limitation, this feature was only available in the paid version of the product. We should definitely deploy something like this now that we have a report that memory can grow that fast.
Next steps are finding what are those leaks, but before you do that, do you have any reason why not to use Ruby 2.7? That version has a new feature - GC compacting or defragmenting. Ruby VM is known for fragmenting memory creating “gaps” on the heap which are never returned to the OS. The latest stable version should be better. Try that the codebase should be 2.7 compatible if I am not mistaken. Compare the graph with what you have here (4+8-8).
Ok, we can try this patch but this may some time to apply.
Next steps are finding what are those leaks, but before you do that, do you have any reason why not to use Ruby 2.7?
Because our company using SLES …all jokes aside, i followed your “Install from Source” instruction and it says “Ruby 2.5 or newer”. So i started with ruby2.5 I can try to build Foreman with ruby2.7, but this will take some time and its not possible to do that on our production system.