He stated before that there is no dynflow:
You can also see that it’s just foreman.service taking up 5 GB of memory:
He stated before that there is no dynflow:
You can also see that it’s just foreman.service taking up 5 GB of memory:
Then try configurations with 1 worker and 1, 8, 16 threads to correlate how it’s groing. IMHO 16 is too many for Ruby with GIL, I haven’t tested but I expect the sweet spot somewhere between 3 - 10 threads.
Just to be sure, I am curious and I’d like to rule out this new setup.
It might be a memory leak introduced in 2.0.0 too.
This is the default:
That in turn is copied from Puma’s defaults: https://github.com/puma/puma#thread-pool
I’d be curious anyway.
What I usually use is SystemTap or dtrace. We have some examples for the former: https://github.com/lzap/foreman-tracer
Or you can use any Ruby memory analyzer to see object allocations, advantage of the tracing is that it’s quite effective and does not slow down your deployment too much.
ok, i started to use the default configuration from the puppet modul for foreman (workers=0, threads_min=0, threads_max=16)
in parallel i try different puma configurations (workers, threads_min, threads_max). it seems that these have an effect on memory consumption.
my experience so far:
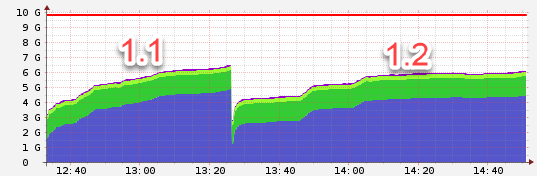
Nodes 1:
1.1 used the defaults, 1.2 worker:2, threads_min: 8, threads_max:16
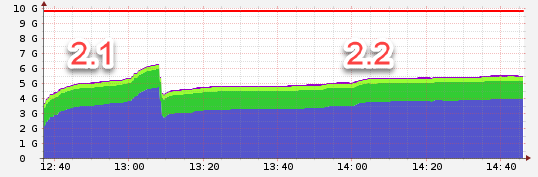
Node 2:
2.1 used the defaults, 2.2 worker: 4, threads_min: 4, threads_max: 8
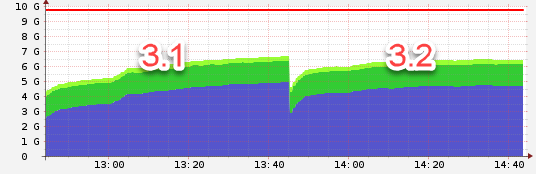
Node 3:
3.1 used the defaults, 3.2 worker: 4, threads_min: 8, threads_max: 16
all have in common that the threads_min is configured to != 0. i will keep watching the different setups.
The differences are insignificant.
Before we dig further, can you double check the list of plugins you have enabled?
Also can you run this simple tool to analyze your rails log and share which controllers and actions are the slowest and mostly used? https://github.com/pmoravec/rails-load-stats
No, we really have no plugins activated or installed.
Yes, i can do that. Our logging type was set to syslog + json, which results in many script errors. I changed the settings and now have to wait until there are some more log entries.
Uh, that’s surprisingly high memory usage then! Let’s wait what do you hit the most.
Oh there is SystemTap in SUSE, you could use our examples to track allocations.
sooo, here are some results so far from my “production-test-node”:
current configuration of puma: workers: 4, threas 8,8
results from the analyze.sh:
there were 15107 requests taking 21401325 ms (i.e. 5.94 hours, i.e. 0.25 days) in summary
type count min max avg mean sum percentage
--------------------------------------------------------------------------------------------------------------------
ConfigReportsController#create 3213 58 1165 90 71 291307 1.36 %
HostsController#facts 3309 23 17043 1811 1555 5995471 28.01 %
HostsController#index 9 51194 105400 72737 64195 654640 3.06 %
PingController#ping 1237 7 273 13 10 17166 0.08 %
PuppetclassesController#index 450 173 432 210 188 94622 0.44 %
SmartClassParametersController#index 8 183 332 215 195 1727 0.01 %
SmartClassParametersController#show 9 188 641 298 211 2682 0.01 %
AuditsController#index 1 2109 2109 2109 2109 2109 0.01 %
ConfigReportsController#index 3 88 93 90 89 270 0.00 %
ConfigReportsController#show 1 63 63 63 63 63 0.00 %
DashboardController#index 6 40 126 60 46 362 0.00 %
DashboardController#show 17 54 6088 504 88 8580 0.04 %
FactValuesController#index 2 104 1425 764 104 1529 0.01 %
HostgroupsController#auto_complete_search 4 18 32 21 18 86 0.00 %
HostgroupsController#edit 2 2923 3225 3074 2923 6148 0.03 %
HostgroupsController#index 6 180 1040 517 193 3106 0.01 %
HostgroupsController#update 3 307 406 350 339 1052 0.00 %
HostsController#auto_complete_search 13 10 28 12 11 166 0.00 %
HostsController#edit 3 1996 2630 2258 2149 6775 0.03 %
HostsController#externalNodes 6416 1172 28292 2227 1713 14292067 66.78 %
HostsController#index 3 202 274 248 270 746 0.00 %
HostsController#multiple_puppetrun 1 94 94 94 94 94 0.00 %
HostsController#nics 5 31 108 65 66 327 0.00 %
HostsController#overview 2 54 96 75 54 150 0.00 %
HostsController#resources 2 73 100 86 73 173 0.00 %
HostsController#runtime 2 632 674 653 632 1306 0.01 %
HostsController#show 2 307 533 420 307 840 0.00 %
HostsController#templates 5 154 255 197 167 986 0.00 %
HostsController#update 3 427 774 577 531 1732 0.01 %
NotificationRecipientsController#index 359 7 129 16 14 5969 0.03 %
PuppetclassesController#auto_complete_search 1 10 10 10 10 10 0.00 %
PuppetclassesController#index 1 229 229 229 229 229 0.00 %
PuppetclassesController#update 1 331 331 331 331 331 0.00 %
SubnetsController#index 2 100 120 110 100 220 0.00 %
UsersController#login 6 7 4140 1380 25 8284 0.04 %
concurrent requests:
- MAX: 14 when processing request with ID 3b7da576
- AVG: 2
- MEAN: 2
- 90%PERCENTILE: 4
First, performance. We have heard that 1.24/2.0 do not perform ENC well, that’s 2/3 of your time spent. I’ve made a patch for 2.1 which is relatively slow and shows good improvements there on my instance, your milage may very depending on what do you have in your database, but try to apply this if this helps:
Now, to the memory. Our experience is that a worker process with some plugins installed including Katello can max out at 2 GB on heavy deployments. This is where you should target a auto restart. This brings a question, @ekohl do we have an automatic worker restart bound to some memory in the new puma deployment? This was one of the passenger limitation, this feature was only available in the paid version of the product. We should definitely deploy something like this now that we have a report that memory can grow that fast.
Next steps are finding what are those leaks, but before you do that, do you have any reason why not to use Ruby 2.7? That version has a new feature - GC compacting or defragmenting. Ruby VM is known for fragmenting memory creating “gaps” on the heap which are never returned to the OS. The latest stable version should be better. Try that the codebase should be 2.7 compatible if I am not mistaken. Compare the graph with what you have here (4+8-8).
Ok, we can try this patch but this may some time to apply.
Next steps are finding what are those leaks, but before you do that, do you have any reason why not to use Ruby 2.7?
Because our company using SLES …all jokes aside, i followed your “Install from Source” instruction and it says “Ruby 2.5 or newer”. So i started with ruby2.5 I can try to build Foreman with ruby2.7, but this will take some time and its not possible to do that on our production system.
I was able to build foreman from source (https://github.com/theforeman/foreman.git -b 2.0-stable) with ruby2.7 and added the fix from above.
But now some gems throw a lot of warnings and i’m not sure, if i should bring this in our production environment so close to the weekend.
/opt/foreman/vendor/ruby/2.7.0/gems/graphql-1.8.17/lib/graphql/schema/mutation.rb:70: warning: Using the last argument as keyword parameters is deprecated; maybe ** should be added to the call
/opt/foreman/vendor/ruby/2.7.0/gems/graphql-1.8.17/lib/graphql/schema/member/has_fields.rb:51: warning: The called method `field' is defined here
/opt/foreman/vendor/ruby/2.7.0/gems/activerecord-5.2.1/lib/active_record/type.rb:27: warning: Using the last argument as keyword parameters is deprecated; maybe ** should be added to the call
/opt/foreman/vendor/ruby/2.7.0/gems/activerecord-5.2.1/lib/active_record/type/adapter_specific_registry.rb:9: warning: The called method `add_modifier' is defined here
/opt/foreman/app/models/concerns/has_many_common.rb:48: warning: Using the last argument as keyword parameters is deprecated; maybe ** should be added to the call
/opt/foreman/vendor/ruby/2.7.0/gems/activerecord-5.2.1/lib/active_record/associations.rb:1368: warning: The called method `has_many' is defined here
/opt/foreman/vendor/ruby/2.7.0/gems/scoped_search-4.1.8/lib/scoped_search/definition.rb:309: warning: Using the last argument as keyword parameters is deprecated; maybe ** should be added to the call
/opt/foreman/vendor/ruby/2.7.0/gems/scoped_search-4.1.8/lib/scoped_search/definition.rb:27: warning: The called method `initialize' is defined here
/opt/foreman/app/models/concerns/has_many_common.rb:48: warning: Using the last argument as keyword parameters is deprecated; maybe ** should be added to the call
/opt/foreman/vendor/ruby/2.7.0/gems/activerecord-5.2.1/lib/active_record/associations.rb:1368: warning: The called method `has_many' is defined here
/opt/foreman/app/models/concerns/has_many_common.rb:53: warning: Using the last argument as keyword parameters is deprecated; maybe ** should be added to the call
/opt/foreman/vendor/ruby/2.7.0/gems/activerecord-5.2.1/lib/active_record/associations.rb:1821: warning: The called method `has_and_belongs_to_many' is defined here
/opt/foreman/app/models/concerns/has_many_common.rb:77: warning: Using the last argument as keyword parameters is deprecated; maybe ** should be added to the call
/opt/foreman/vendor/ruby/2.7.0/gems/activerecord-5.2.1/lib/active_record/associations.rb:1653: warning: The called method `belongs_to' is defined here
/opt/foreman/vendor/ruby/2.7.0/gems/scoped_search-4.1.8/lib/scoped_search/definition.rb:309: warning: Using the last argument as keyword parameters is deprecated; maybe ** should be added to the call
/opt/foreman/vendor/ruby/2.7.0/gems/scoped_search-4.1.8/lib/scoped_search/definition.rb:27: warning: The called method `initialize' is defined here
/opt/foreman/app/models/concerns/has_many_common.rb:53: warning: Using the last argument as keyword parameters is deprecated; maybe ** should be added to the call
/opt/foreman/vendor/ruby/2.7.0/gems/activerecord-5.2.1/lib/active_record/associations.rb:1821: warning: The called method `has_and_belongs_to_many' is defined here
/opt/foreman/app/models/concerns/has_many_common.rb:77: warning: Using the last argument as keyword parameters is deprecated; maybe ** should be added to the call
/opt/foreman/vendor/ruby/2.7.0/gems/activerecord-5.2.1/lib/active_record/associations.rb:1653: warning: The called method `belongs_to' is defined here
SHIP IT!
We have a lots of deps, chances are this might break. Wait for Monday morning then.
Yes, i will wait for Monday.
Your fix has a very good impact on CPU consumption:
Wow you run Foreman with 10g Memory? i pimped by Foreman Server with 6 Core and 32GB Ram for around 100 Systems. Every 2-3 Days the System explodes eating all Memory and Swapspace. Most times mongod get killed because out of memory. Sometimes Publishing a large content view (Ol7, Epel some addtional small repos) lead to of of memory and i have to restart Foreman. I have this issue with two Server over all Foreman Versions the last 2 Years.
Seems to be something really weird at your configuration. We’ve connected around 2000 Systems to our production system (4x 4CPUs+ 10G Ram), but no plugins added yet
I think it’s apples and oranges here. @chr1s is running pure Foreman (from sources) without Katello (perhaps even Puppet on a different node?) while @sjansen appears to run Katello-MongoDB-Candlepin-Puppet full stack.
Anyway, that patch did help for CPU a little bit. I guess you don’t see any memory improvements.
Any news to share?
One sidenote, @ekohl have realized that Puppet is calling ENC twice for some reason. If we find why is that and fix this, 1/2 of your queries would disappear. This won’t help with memory hog much, possibly makes it slower but it is worth noting.