
Problem:
Hello everybody, after update to new version of foreman, I see much more memory consumption by puma workers ~ 10 GB/worker.
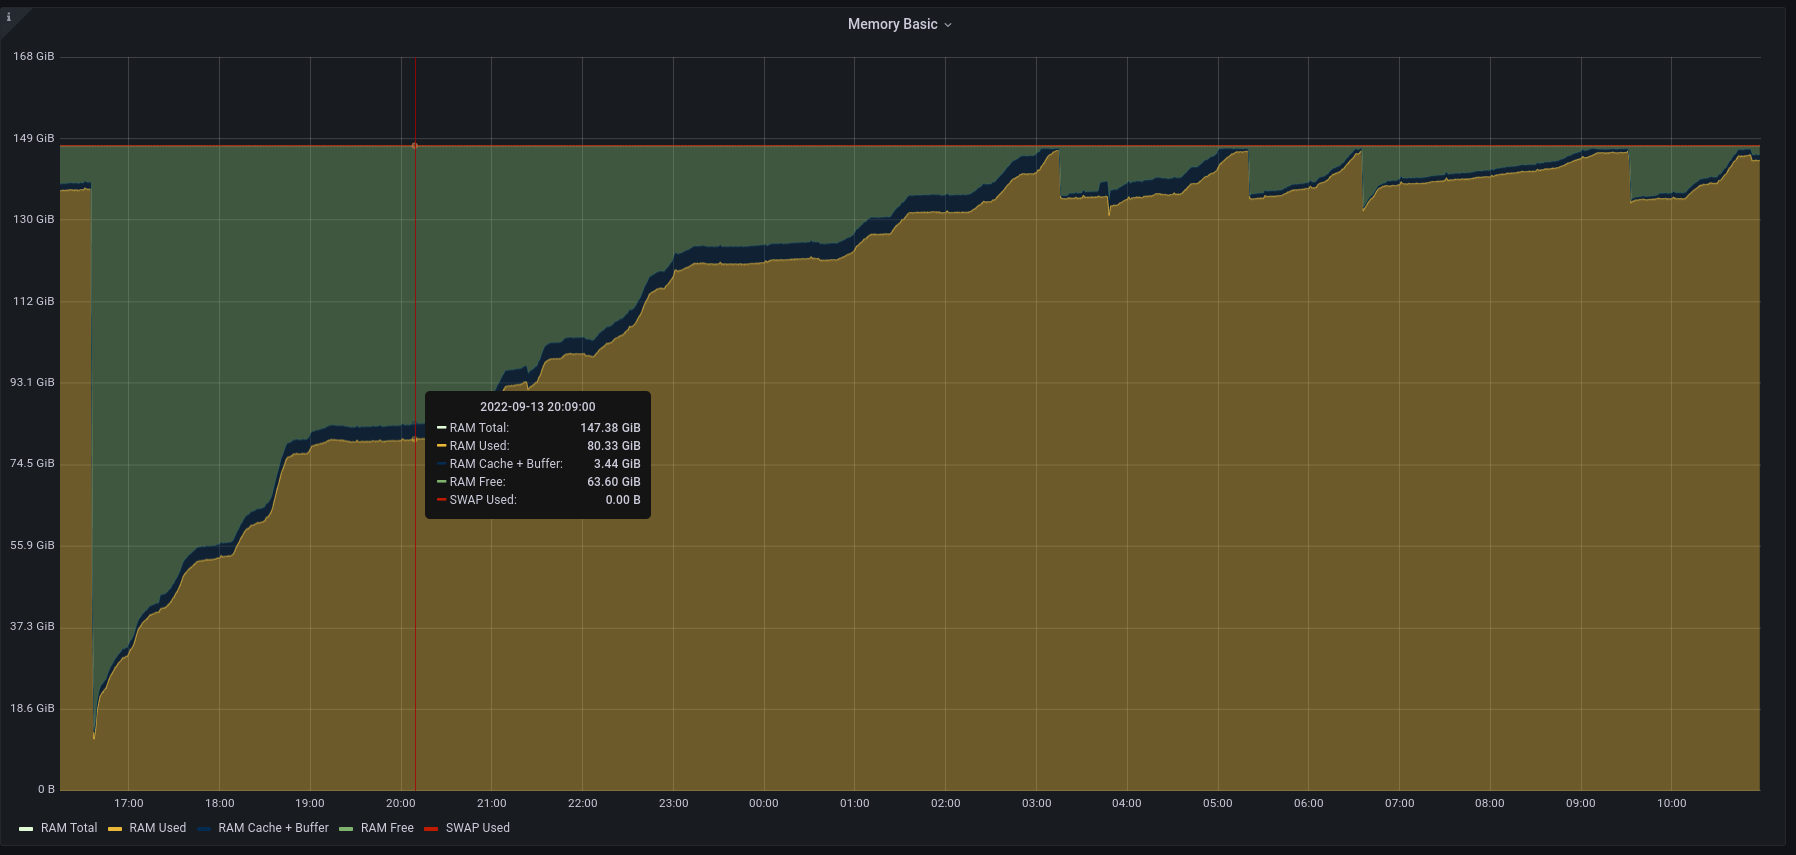
Summory consumption goes above 100GB and cause OOM.
Here’s memory consumption graph after restart service.
top command
top - 11:00:50 up 4 days, 17:40,  5 users,  load average: 16.70, 12.88, 11.19
Tasks: 698 total,   5 running, 686 sleeping,   7 stopped,   0 zombie
%Cpu(s): 26.8 us,  1.5 sy,  0.0 ni, 48.0 id,  0.0 wa,  0.0 hi,  0.2 si, 23.5 st
KiB Mem : 15453467+total, 57984672 free, 93166152 used,  3383852 buff/cache
KiB Swap:        0 total,        0 free,        0 used. 60085848 avail Mem

   PID USER      PR  NI    VIRT    RES    SHR S  %CPU %MEM     TIME+ COMMAND
227194 foreman   20   0   10.5g   9.8g   6736 S  87.3  6.6  76:17.11 puma: cluster worker 8: 226143 [foreman]
227102 foreman   20   0 9061332   7.7g   9372 S  88.6  5.2  73:08.91 puma: cluster worker 3: 226143 [foreman]
227077 foreman   20   0 8430720   7.1g   9256 S  78.4  4.8  59:06.48 puma: cluster worker 2: 226143 [foreman]
227238 foreman   20   0 7375508   6.1g   9320 S  88.2  4.2  58:28.94 puma: cluster worker 13: 226143 [foreman]
227245 foreman   20   0 6174864   5.3g   6760 S  69.4  3.6  65:02.20 puma: cluster worker 14: 226143 [foreman]
227180 foreman   20   0 5971336   5.0g   9260 S  24.1  3.4  55:23.90 puma: cluster worker 6: 226143 [foreman]
227135 foreman   20   0 5571124   4.6g   9236 S  29.0  3.1  53:17.62 puma: cluster worker 4: 226143 [foreman]
226875 tomcat    20   0   20.1g   4.5g  16192 S 115.1  3.1 133:33.87 /usr/lib/jvm/jre/bin/java -Xms1024m -Xmx8192m -Djava.security.auth.login.config=/usr/share/tomcat/conf/login.config -cla+
227222 foreman   20   0 5551716   4.5g   7172 S  62.4  3.0  47:51.52 puma: cluster worker 11: 226143 [foreman]
227229 foreman   20   0 5175472   4.3g   9356 S  78.0  2.9  59:44.31 puma: cluster worker 12: 226143 [foreman]
227069 foreman   20   0 5240040   4.2g   9276 S  39.6  2.9  50:16.83 puma: cluster worker 1: 226143 [foreman]
227164 foreman   20   0 5181704   4.2g   6980 S  54.3  2.8  54:11.25 puma: cluster worker 5: 226143 [foreman]
227187 foreman   20   0 4877232   4.1g   9344 S  67.3  2.8  53:44.99 puma: cluster worker 7: 226143 [foreman]
227255 foreman   20   0 5091848   4.0g   9360 S  39.2  2.7  50:57.22 puma: cluster worker 15: 226143 [foreman]
227063 foreman   20   0 4706908   3.6g   6724 S  64.9  2.5  48:49.89 puma: cluster worker 0: 226143 [foreman]
227211 foreman   20   0 2253420   1.6g   9404 S  60.8  1.1  48:46.71 puma: cluster worker 10: 226143 [foreman]
Foreman and Proxy versions:
foreman-2.3.1.25-2
foreman-proxy-2.3.1-1
tfm-rubygem-puma-plugin-systemd-0.1.5-1
tfm-rubygem-puma-4.3.6-1
Foreman and Proxy plugin versions:
| foreman-tasks | 3.0.6 |
|---|---|
| foreman_ansible | 6.1.1 |
| foreman_azure_rm | 2.1.3 |
| foreman_bootdisk | 17.0.2 |
| foreman_discovery | 16.3.6 |
| foreman_hooks | 0.3.17 |
| foreman_openscap | 4.1.3 |
| foreman_remote_execution | 4.2.3.1 |
| foreman_rh_cloud | 3.0.26 |
| foreman_templates | 9.0.2 |
| foreman_theme_satellite | 7.0.1.7 |
| foreman_virt_who_configure | 0.5.5 |
| katello | 3.18.1.50 |
| redhat_access | 2.9.1 |
Distribution and version:
Red Hat Enterprise Linux 7.9
Other relevant data:
foreman.service
# /usr/lib/systemd/system/foreman.service
[Unit]
Description=Foreman
Documentation=https://theforeman.org
After=network.target remote-fs.target nss-lookup.target
Requires=foreman.socket

[Service]
Type=notify
User=foreman
TimeoutSec=300
WorkingDirectory=/usr/share/foreman
ExecStart=/usr/share/foreman/bin/rails server --environment $FOREMAN_ENV
Environment=FOREMAN_ENV=production FOREMAN_BIND=tcp://0.0.0.0:3000
Environment=MALLOC_ARENA_MAX=2

SyslogIdentifier=foreman

[Install]
WantedBy=multi-user.target

# /etc/systemd/system/foreman.service.d/installer.conf
[Service]
User=foreman
Environment=FOREMAN_ENV=production
Environment=FOREMAN_HOME=/usr/share/foreman
Environment=FOREMAN_BIND=unix:///run/foreman.sock
Environment=FOREMAN_PUMA_THREADS_MIN=5
Environment=FOREMAN_PUMA_THREADS_MAX=5
Environment=FOREMAN_PUMA_WORKERS=16
# /etc/systemd/system/foreman.service.d/limits.conf
[Service]
MemoryLimit=100G
MemoryAccounting=yes
CPUAccounting=yes
analyze.sh
there were 2082375 requests taking 648289001 ms (i.e. 180.08 hours, i.e. 7.50 days) in summary

type						count	min	max	avg	mean	sum		percentage
--------------------------------------------------------------------------------------------------------------------
ApipiesController#index                        	1	13	13	13	13	13		0.00 %
AnsibleInventoriesController#schedule          	1	801	801	801	801	801		0.00 %
ArchitecturesController#index                  	8	60	263	155	159	1242		0.00 %
AuditsController#index                         	2	85	95	90	85	180		0.00 %
BookmarksController#index                      	86	35	1712	99	52	8554		0.00 %
ConfigReportsController#create                 	40958	75	80412	380	159	15594921	2.41 %
DomainsController#index                        	15	163	1727	337	221	5057		0.00 %
HomeController#status                          	1	850	850	850	850	850		0.00 %
HostgroupsController#index                     	24	241	117688	47522	70032	1140537		0.18 %
HostgroupsController#show                      	5	287	670	508	515	2544		0.00 %
HostsController#create                         	5	980	21946	5384	1068	26924		0.00 %
HostsController#destroy                        	9	2028	8383	5266	5690	47400		0.01 %
HostsController#disassociate                   	9	557	2934	1498	1393	13484		0.00 %
HostsController#facts                          	41662	592	1834771	4650	1678	193742882	29.89 %
HostsController#index                          	8853	194	154283	8661	6700	76682902	11.83 %
HostsController#power_status                   	665	19	3338	117	53	78459		0.01 %
HostsController#show                           	5	208	961	473	372	2368		0.00 %
HttpProxiesController#index                    	3	60	152	98	83	295		0.00 %
LocationsController#index                      	5	171	296	234	216	1170		0.00 %
OperatingsystemsController#index               	169	229	17733	718	442	121361		0.02 %
OrganizationsController#index                  	5	165	559	295	245	1478		0.00 %
PingController#statuses                        	85	5792	34803	11093	9824	942938		0.15 %
ReportTemplatesController#report_data          	89	87	993	190	139	16959		0.00 %
SettingsController#update                      	4	54	163	92	68	369		0.00 %
SmartProxiesController#index                   	15	159	339	241	222	3620		0.00 %
BastionController#index                        	13	113	368	222	224	2895		0.00 %
DashboardController#index                      	19	2	278	70	29	1344		0.00 %
DashboardController#show                       	69	56	30523	1169	175	80675		0.01 %
FactValuesController#auto_complete_search      	22	18	6671	1967	1934	43282		0.01 %
FactValuesController#index                     	58	2	4007	545	398	31652		0.00 %
TasksController#bulk_search                    	48	58	1598	282	140	13549		0.00 %
TasksController#index                          	844	180	27925	582	291	491268		0.08 %
HostsController#auto_complete_search           	26	31	3070	1347	1678	35029		0.01 %
HostsController#destroy                        	15	1174	7599	2920	2055	43808		0.01 %
HostsController#externalNodes                  	81488	90	85960	982	401	80098791	12.36 %
HostsController#index                          	58	2	3682	888	645	51530		0.01 %
HostsController#multiple_disassociate          	1	678	678	678	678	678		0.00 %
HostsController#nics                           	7	57	218	127	141	891		0.00 %
HostsController#overview                       	7	199	525	326	292	2285		0.00 %
HostsController#resources                      	7	39	292	147	127	1035		0.00 %
HostsController#runtime                        	7	66	1838	528	140	3702		0.00 %
HostsController#show                           	7	394	3675	1216	434	8514		0.00 %
HostsController#templates                      	6	479	2796	1059	566	6357		0.00 %
HostsController#update_multiple_disassociate   	1	471	471	471	471	471		0.00 %
HostsController#vm                             	1	2237	2237	2237	2237	2237		0.00 %
MachineTelemetriesController#branch_info       	23	32	402	88	60	2034		0.00 %
MachineTelemetriesController#forward_request   	39	198	2270	856	708	33406		0.01 %
CandlepinProxiesController#consumer_activate   	6	5518	8218	6952	6673	41716		0.01 %
CandlepinProxiesController#consumer_show       	103570	23	42060	167	90	17353902	2.68 %
CandlepinProxiesController#facts               	47554	118	1800544	1063	191	50593172	7.80 %
CandlepinProxiesController#get                 	452169	18	35807	100	51	45302219	6.99 %
CandlepinProxiesController#post                	161	93	10501	358	178	57725		0.01 %
CandlepinProxiesController#serials             	442333	20	41568	151	76	66994599	10.33 %
CandlepinProxiesController#server_status       	442373	12	46504	84	42	37445508	5.78 %
ActivationKeysController#index                 	1	913	913	913	913	913		0.00 %
ActivationKeysController#product_content       	2	807	1343	1075	807	2150		0.00 %
ActivationKeysController#show                  	1	211	211	211	211	211		0.00 %
CapsuleContentController#sync_status           	1204	212	160338	22629	13706	27246050	4.20 %
CapsulesController#index                       	255	452	29645	1406	1049	358545		0.06 %
ContentCredentialsController#index             	3	744	3418	1800	1240	5402		0.00 %
ContentViewComponentsController#update         	2	63	161	112	63	224		0.00 %
ContentViewFiltersController#index             	5	133	238	181	170	905		0.00 %
ContentViewFiltersController#show              	15	125	324	205	201	3080		0.00 %
ContentViewsController#auto_complete_search    	5	13	15	14	14	70		0.00 %
ContentViewsController#index                   	132	149	48568	7098	5072	936942		0.14 %
ContentViewsController#show                    	28	69	4212	626	266	17554		0.00 %
ContentViewVersionsController#index            	29	143	7420	1466	791	42514		0.01 %
ContentViewVersionsController#show             	14	181	713	342	283	4798		0.00 %
EnvironmentsController#index                   	169	5018	33434	11794	11158	1993293		0.31 %
EnvironmentsController#paths                   	14	1436	3381	2544	2638	35620		0.01 %
HostAutocompleteController#auto_complete_search	10	44	1431	543	75	5434		0.00 %
HostSubscriptionsController#index              	4	423	596	497	478	1991		0.00 %
HostSubscriptionsController#product_content    	2	826	948	887	826	1774		0.00 %
OrganizationsController#index                  	20	28	1119	555	499	11116		0.00 %
OrganizationsController#show                   	3	461	900	749	888	2249		0.00 %
PackagesController#auto_complete_name          	11	92	969	199	114	2192		0.00 %
PackagesController#index                       	4	185	241	216	214	867		0.00 %
ProductsController#index                       	64	468	8174	2298	1914	147117		0.02 %
ProductsController#show                        	21	300	34444	4095	460	86015		0.01 %
RepositoriesController#auto_complete_search    	8	22	184	63	36	505		0.00 %
RepositoriesController#gpg_key_content         	17	12	2513	240	47	4093		0.00 %
RepositoriesController#index                   	219	160	74939	5809	4197	1272247		0.20 %
RepositoriesController#show                    	8	139	374	217	171	1737		0.00 %
RootController#rhsm_resource_list              	415379	20	30167	69	38	28842630	4.45 %
SubscriptionsController#index                  	6	266	3145	1674	415	10044		0.00 %
NotificationRecipientsController#index         	1086	8	16633	59	16	65130		0.01 %
..tionRecipientsController#update_group_as_read	1	43	43	43	43	43		0.00 %
OrganizationsController#select                 	2	9	15	12	9	24		0.00 %
ReactController#index                          	1	110	110	110	110	110		0.00 %
SettingsController#index                       	4	2	958	596	711	2386		0.00 %
UsersController#login                          	10	54	373	144	100	1444		0.00 %

concurrent requests:
- MAX: 360 when processing request with ID 'eff2f5e0'
- AVG: 133