
The first part of the graphs are without ‘passenger-recycler’ and after that with it “on”. Nice before and after 
Ok, 300 creations of Nic::Base in 30 minutes is not interesting spike at all, as well as 320k ruby object creations in hosts/facts action in 30 minutes is nothing really interesting. We know what fact importing code is our biggest bottleneck so far.
It is worth aggregating all allocations for all classes and controller/actions and watch rate of that, are there any spikes? It is useful to pair those with memory consumption of Rails processes as well, so you can compare the graphs when you see sudden increase.
One important thing, Ruby VM is known to never return memory back to OS, Ruby processes only grow up to the point where they must be restarted. Foreman suffers from this as well, we all know it, passenger is set to restart process worker after 10k requests. If thats not enough use passenger-recycler or change that setting.
Seeing as I’m a total noob at this, could you tell me what I should type in as a graph command? That way you would be able to see what you are most interrested in seeing, and then I’ll post a screenshot of it.
/K
To get total number of AR allocations:
sum(rate(fm_rails_activerecord_instances[5m]))
the same for Ruby object allocations:
sum(rate(fm_rails_ruby_gc_allocated_objects[5m]))
You want to watch request processing rate:
sum(rate(fm_rails_http_requests[5m]))
Here is average request processing graph:
sum(fm_rails_http_request_total_duration_sum / fm_rails_http_request_total_duration_count)
Those are the basic ones, more on the deep dive.
You want to run node_exporter to also get Linux OS information and you must also run passenger exporter to get data from passenger (RSS and memory info):
Then you can watch everything on one dashboard and do some decisions.
Thank you very much, I´ve started looking at them and can see spikes every 15 mins going up and down. I´ve also enabled all the debugging I can without passenger not wanting to start for unknown reasons, and I thought this might be interesting to you:
2018-03-08T13:35:00 08095d8e [app] [I] Completed 500 Internal Server Error in 359479ms (Views: 32.8ms | ActiveRecord: 2924.8ms)
There are lots of those:
# grep -E '([0-9]{6}+)ms' log/production.log | wc -l
5958
Am I on to something there? Would it be interesting to you to see a full flow of that, like grep 08095d8e log/production.log ?
/K
Should I start an issue instead of discussing this on the forum?
/K
No this is fine, I was on vacation.
So you are doing your investigation right, do the grep again and find transasction id which is the second column of the log (e.g. 08095d8e in your example). Then grep this id again and pastebin the whole transaction. I bet this is puppet or report import, that’s quite slow operation with many bottlenecks.
The super slow performance is perhaps due to swapping. You obviously hit some memory leak.
Can you restart whole app and then monitor memory of passenger processes, can you identify how it grows? Is it constant or sudden? Correlate that with requests to identify what is causing that, if it is possible.
Unfortunately, most of us are on PostgreSQL and while fact upload is demanding and not super fast, it is possible to scale it and we do not see such big mem leaks.
lzap DiscoveryMarch 20
The super slow performance is perhaps due to swapping.
No, no swapping at all at that point, even had RAM unused as I recall.
You obviously hit some memory leak.
Can you restart whole app and then monitor memory of passenger
processes, can you identify how it grows? Is it constant or sudden?
I would say that the increases in RAM usage comes in bursts, like it
stays at a level and holds there until the next increase, and so on.
Like a staircase with broad steps ![]()
Correlate that with requests to identify what is causing that, if it
is possible.
I would say it comes in waves, possibly correlated with the host in
question, but I can try to shut the Puppet agent down in the server and
see if that changes anything.
Unfortunately, most of us are on PostgreSQL and while fact upload is
demanding and not super fast, it is possible to scale it and we do
not see such big mem leaks.
I´m open to trying things out, the Puppet/Foreman server is using a
local MariaDB, so it can be replaced if need be. But it would be nicer
to identify the underlying problem instead of just changing to
something else that just hides it.
/K
I confirmed my suspicion that it is the two very similar servers that I use as hypervisors in my oVirt infra that are causing this!
I disabled ‘passenger-recycler’ and the puppet agent in the two hypervisors, and then started collecting the total amount of RAM that Passenger processes are using and let it run for about an hour:
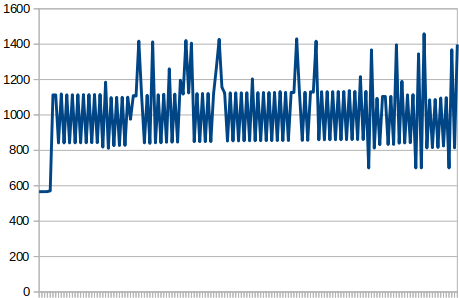
Then I restarted the puppet agent in the two hypervisors and let it run for another hour:
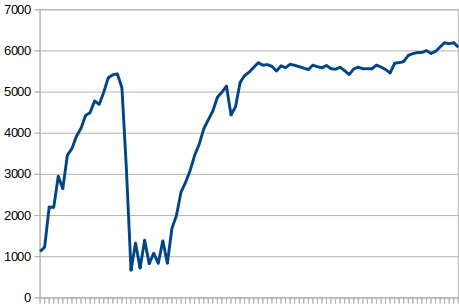
As you can see, the difference is staggering! Then there´s a dip in the RAM usage that quickly goes up again. I think that might be an idle passenger process that was killed because of a setting I have in Apache: PassengerPoolIdleTime 30
So it´s definitely got something to do with the two hypervisor servers (game and hive). Where do we go from here?
/K
Are you using puppetserver (standalone java, used by default with puppet 4 and higher) or puppet master (passenger application, used on puppet 3)? If performance matters I’d highly advise puppetserver. Its initial memory usage might be a bit higher but is much more predictable and scales better.
I am indeed using puppetserver.
/K
We recently merged a pull request that seemed to lead to significant improvement on mysql:
https://github.com/theforeman/foreman/pull/5111
This would have an improvement especially if your database has a large number of audits in it. To test if this helps, you can try to temporarily create an index in your database and see if it has any impact on load:
CREATE INDEX temp_index ON audits(auditable_id, auditable_type, version)
Another thing to check, that can also reduce general system load, is under Settings → Provisioning → Ignore interfaces with matching identifier. You can add any interfaces that you don’t care about inside foreman, such as the internal virtual interfaces your hypervisors use for their VMs which most likely aren’t relevant in the context of foreman. Creating interfaces is one of the slowest parts of the fact import, so even reducing a few interfaces being imported from the facts can have a significant impact.
If that was slow database, we’d see more time spent in there, but Rails obviously reports just few seconds spent in DB and all the rest (minute or more) was in Rails controllers. That’s weird. To me this looks like more of poor Rails performance than MySQL.
Anyway, can you count how many records you have in these tables: fact_names, fact_values, logs, reports, audits, messages and digests? Out of curiousity.
That seems to be in line with multiple interface creation, I’ve seen cases of multiple minutes (sometimes as much as 15 or more) spent creating interfaces, and time is spent in rails controller, not db.
lzap DiscoveryMarch 22
If that was slow database, we’d see more time spent in there, but
Rails obviously reports just few seconds spent in DB and all the rest
(minute or more) was in Rails controllers. That’s weird. To me this
looks like more of poor Rails performance than MySQL.
Anyway, can you count how many records you have in these tables:
fact_names, fact_values, logs, reports, audits, messages and digests?
Out of curiousity.
Absolutely! But you’ll have to tell me how, because I´m terrible at
databases ![]()
/K
tbrisker CoreMarch 22
That seems to be in line with multiple interface creation, I’ve seen
cases of multiple minutes (sometimes as much as 15 or more) spent
creating interfaces, and time is spent in rails controller, not db.
Wow, that is phenomenally bad! ![]() (from a users point of view, I mean,
(from a users point of view, I mean,
I´ve no idea what this process requires code-wise) It does seem like a
perfect match to what I´m experiencing, so I´ll check that out and
report back after it´s evaluated!
Seems like if it can become this bad with just two clients, it should
be communicated a lot more clearly, that if you want to manage e.g.
10-15 hypervisors, you have to do this, or else your Foreman server
is going to explode! ![]()
Or maybe I´ve just missed it? Or is there work scheduled for
improvement in this particular area, if at all possible?
/K
1.17 will default to include more ignored interfaces for openshift and openstack ('tap*', 'qbr*', 'qvb*', 'qvo*', 'qr-*', 'qg-*', 'br*', 'veth*', 'vlinuxbr*', 'vovsbr*'), but if you have some others (your logs seem to indicate jumbo* if I understand correctly) ignoring them will speed fact processing up and hopefully reduce the general system load.
Looking into the logs you uploaded, looks like the interface processing in your case took about 5 minutes - while this might be caused by completely unrelated load, I would test if ignoring some of them causes reduced load.