I have a Foreman/Puppet server that is constantly eating all of my RAM in the server, plus all of the swap. I´ve bumped it up as far as I can on that hardware, it now has 16GB of RAM and 32GB of swap. Here´s passenger status:
----------- General information -----------
Max pool size : 3
App groups    : 1
Processes     : 3
Requests in top-level queue : 0

----------- Application groups -----------
/usr/local/share/foreman:
  App root: /usr/local/share/foreman
  Requests in queue: 84
  * PID: 9929    Sessions: 1       Processed: 2       Uptime: 10h 54m 24s
    CPU: 5%      Memory  : 4401M   Last used: 10h 24m
  * PID: 11282   Sessions: 1       Processed: 464     Uptime: 10h 24m 35s
    CPU: 100%    Memory  : 2848M   Last used: 12m 35s
  * PID: 11968   Sessions: 1       Processed: 486     Uptime: 10h 9m 28s
    CPU: 96%     Memory  : 3109M   Last used: 12m 29s
On this VM I am running Foreman (16.0), MariaDB, Puppetserver, Puppet client, Apache24 and Foreman Proxy.
Is this normal for a Foreman server with 16 clients? If so, how much RAM would it need to stop swapping?
Its not normal at all, which plugins do you have installed?
Good! That is at least good to know:)
I’m not sure which plugins I have installed, it’s a default installation, basically. Is there a rake command or something that lists which plugins are installed? The only one I know I have installed afterwards is the foreman_discovery plugin.
We rely on passenger open-source version which has poor options in recycling worker processes. In newest version of Foreman there is now passenger-recycle small script which does the job (part of rubygem-foreman_maintain package). Here is little bit outdated version of the script (final is little bit different around configuration I think):
Use this to recycle your processes until you find root cause.
We don’t provide yet any tools for diagnosis, you need to figure out yourself which requests cause memory to grow. Ideally, pair your monitoring data with production.log and try to find those requests. Also good measure are slow queries - these often allocate lots of Ruby objects, so try to find slow queries in production log (pattern \d\d\d\dms or more digits).
I am working on Foreman telemetry which will instantly give you more answers - which actions are slow, where are Ruby and ActiveRecords allocation peaks and other data. It’s not yet merged, but backporting into any version should be easy if you want to try it (most of the code is brand new).
Awe! Some! Thanks for pointing me towards the telemetry stuff, you answered my question without me even giving it
And thanks for the cleaning thingie as well, a lot more elegant than the hourly apache reloading I´ve resorted to, heh! This environment is my home lab I´ve set up just for fun and giggles but I´m trying to use it to it´s fullest, got it hooked up towards my SAMBA AD with users, roles and stuff like that. Wouldn´t surprise me if it turns out to be related somehow. I´ll look into the telemetry stuff and report back!
So it took a while to get it running, since I´m using FreeBSD, so I had to look around for some help. Fortunately, there are very helpful people around the FreeBSD mailing lists
I eventually got it running to the point that it was saying “No, this stuff just works on linux!”, I started hacking it. It now runs and does what you´d expect. Since “private dirty RSS” isn´t available, I used the process´s RSS instead, which is far for perfect but better than nothing. It now kills the passenger processes if they go out of control. I´ve attached a patch that applies cleanly towards foreman_maintain-0.1.3.
Now I can start looking at the telemetry stuff you pointed me towards. Thank you!
“Sorry, new users can not upload attachments.” Well, screw it then…
I’m working on getting ‘statsd_exporter’ going with prometheus and it seems I’m having issues getting anything into prometheus. If I go to ‘http://#{address}:9102/metrics’ I can see all of the data:
# HELP fm_rails_activerecord_instances Number of instances of ActiveRecord models
# TYPE fm_rails_activerecord_instances counter
fm_rails_activerecord_instances{class="ActiveRecord__SessionStore__Session"} 13
fm_rails_activerecord_instances{class="AuthSource"} 6
fm_rails_activerecord_instances{class="Bookmark"} 0
...
But if I go to ‘http://#{address}:9090’ there’s nothing at all!? I mean, I have the Prometheus interface and all, but no data. There’s a blue button called ‘Add Graph’, but nothing happens when you click it. I can go to ‘Status -> Targets’ and see my ‘statsd_exporter’ instance running, it says it’s ‘UP’, last scraped seconds ago, but nothing shows up like graphs.
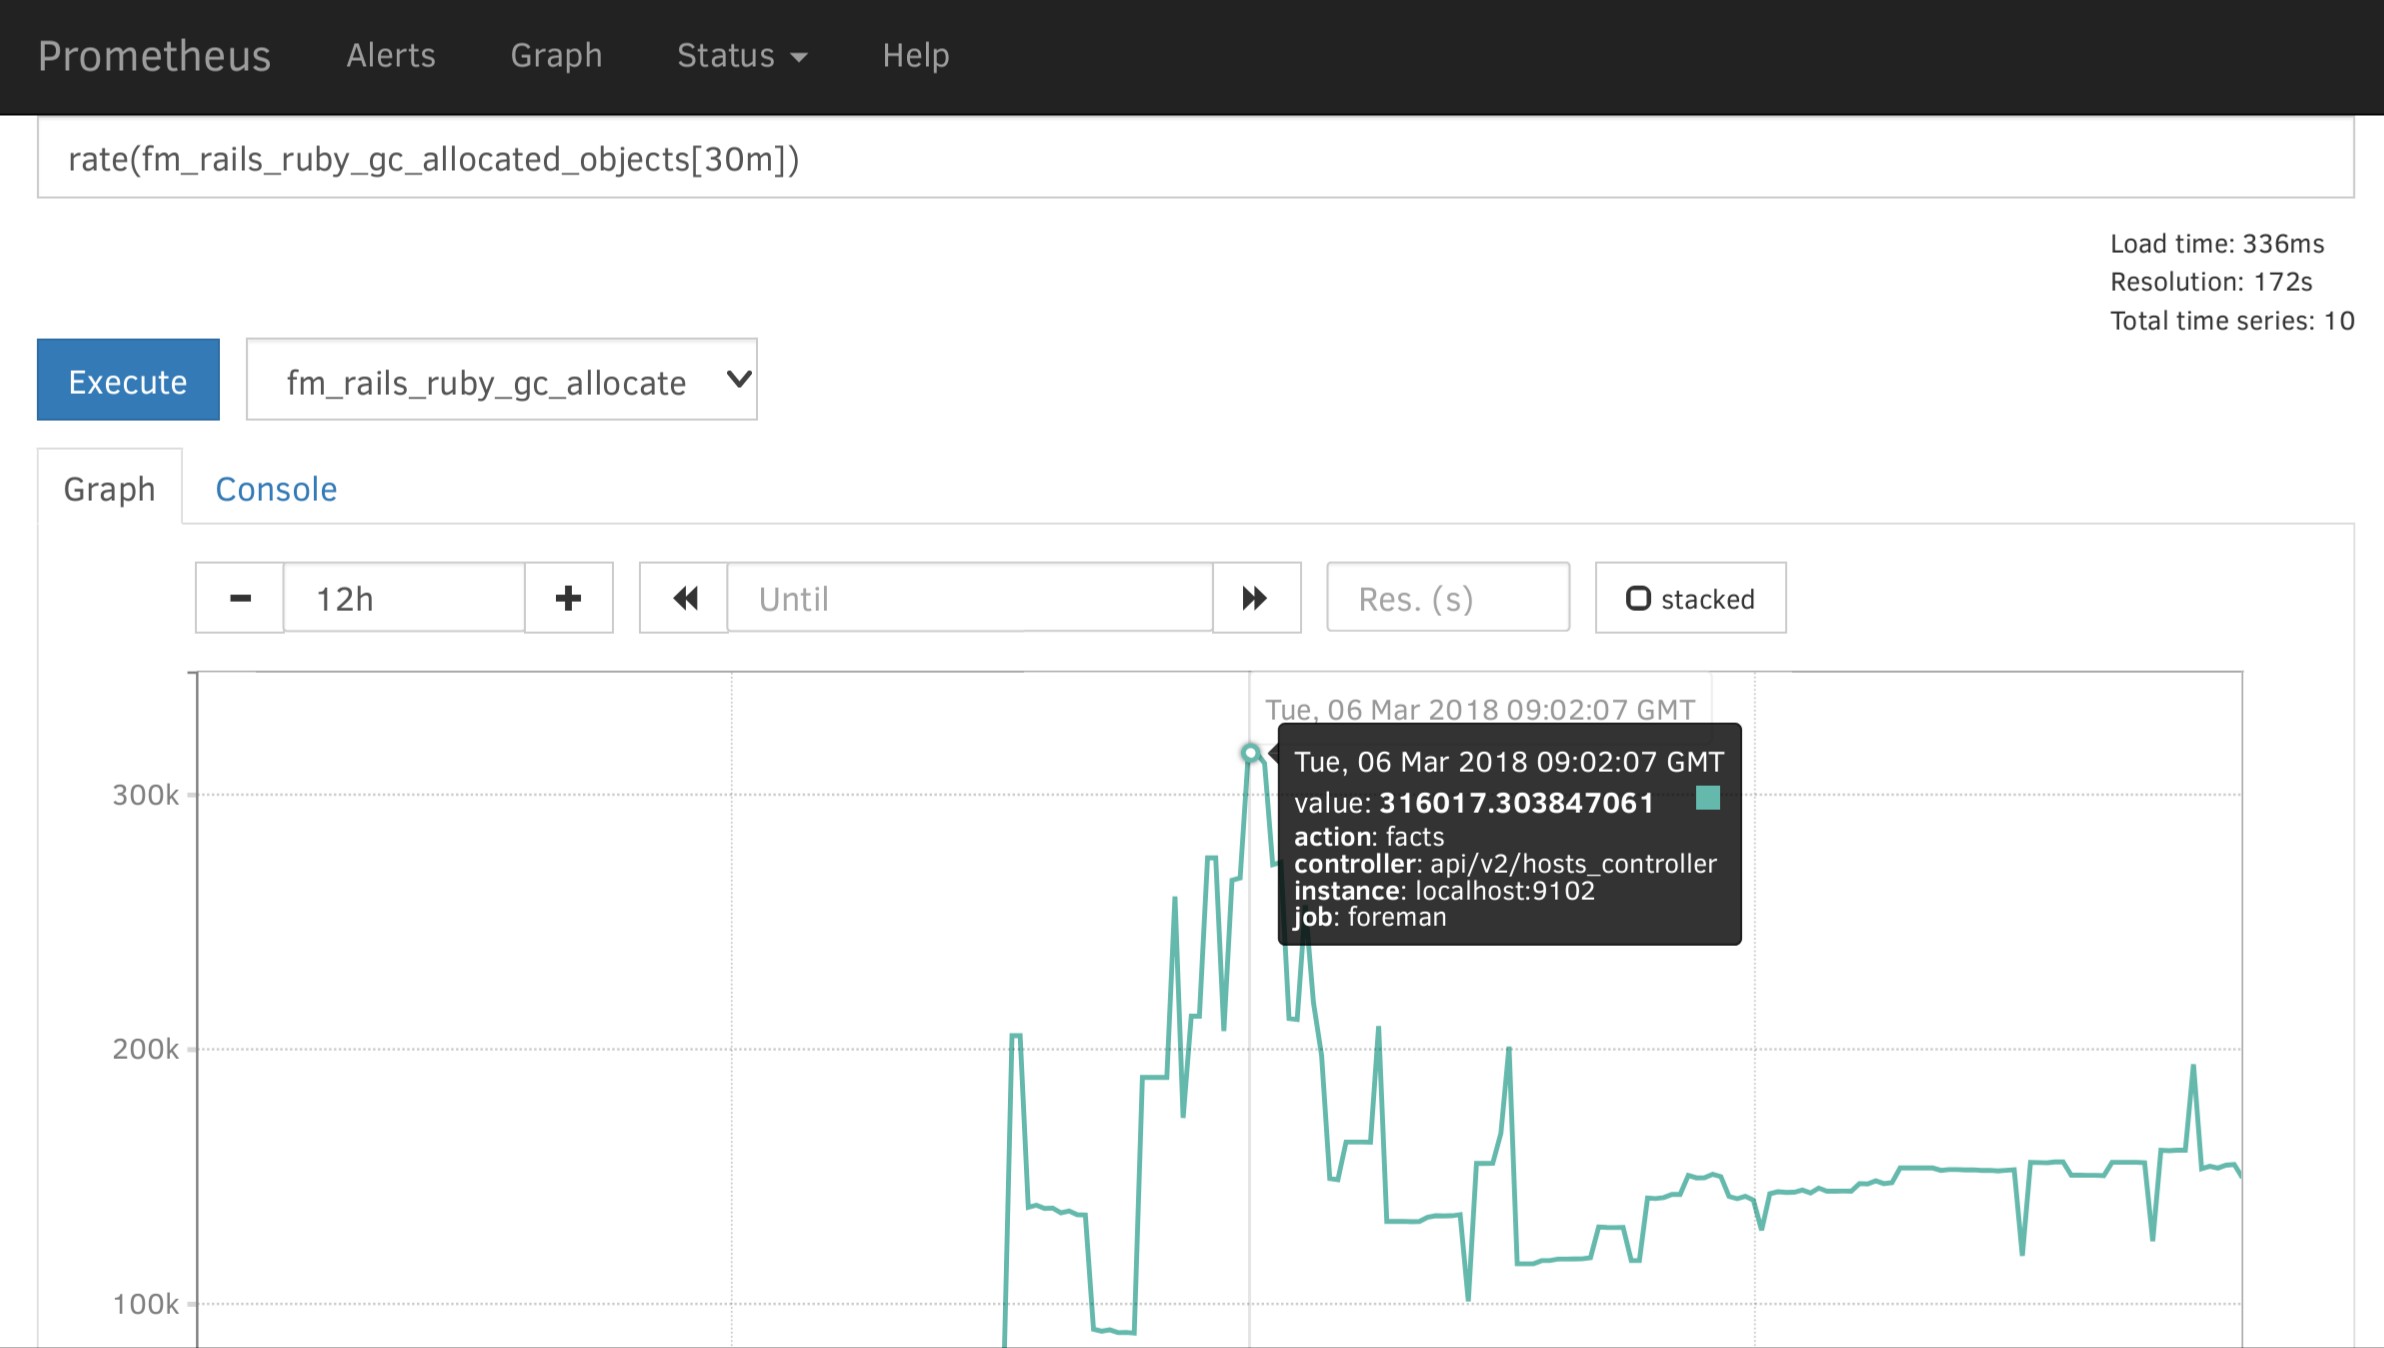
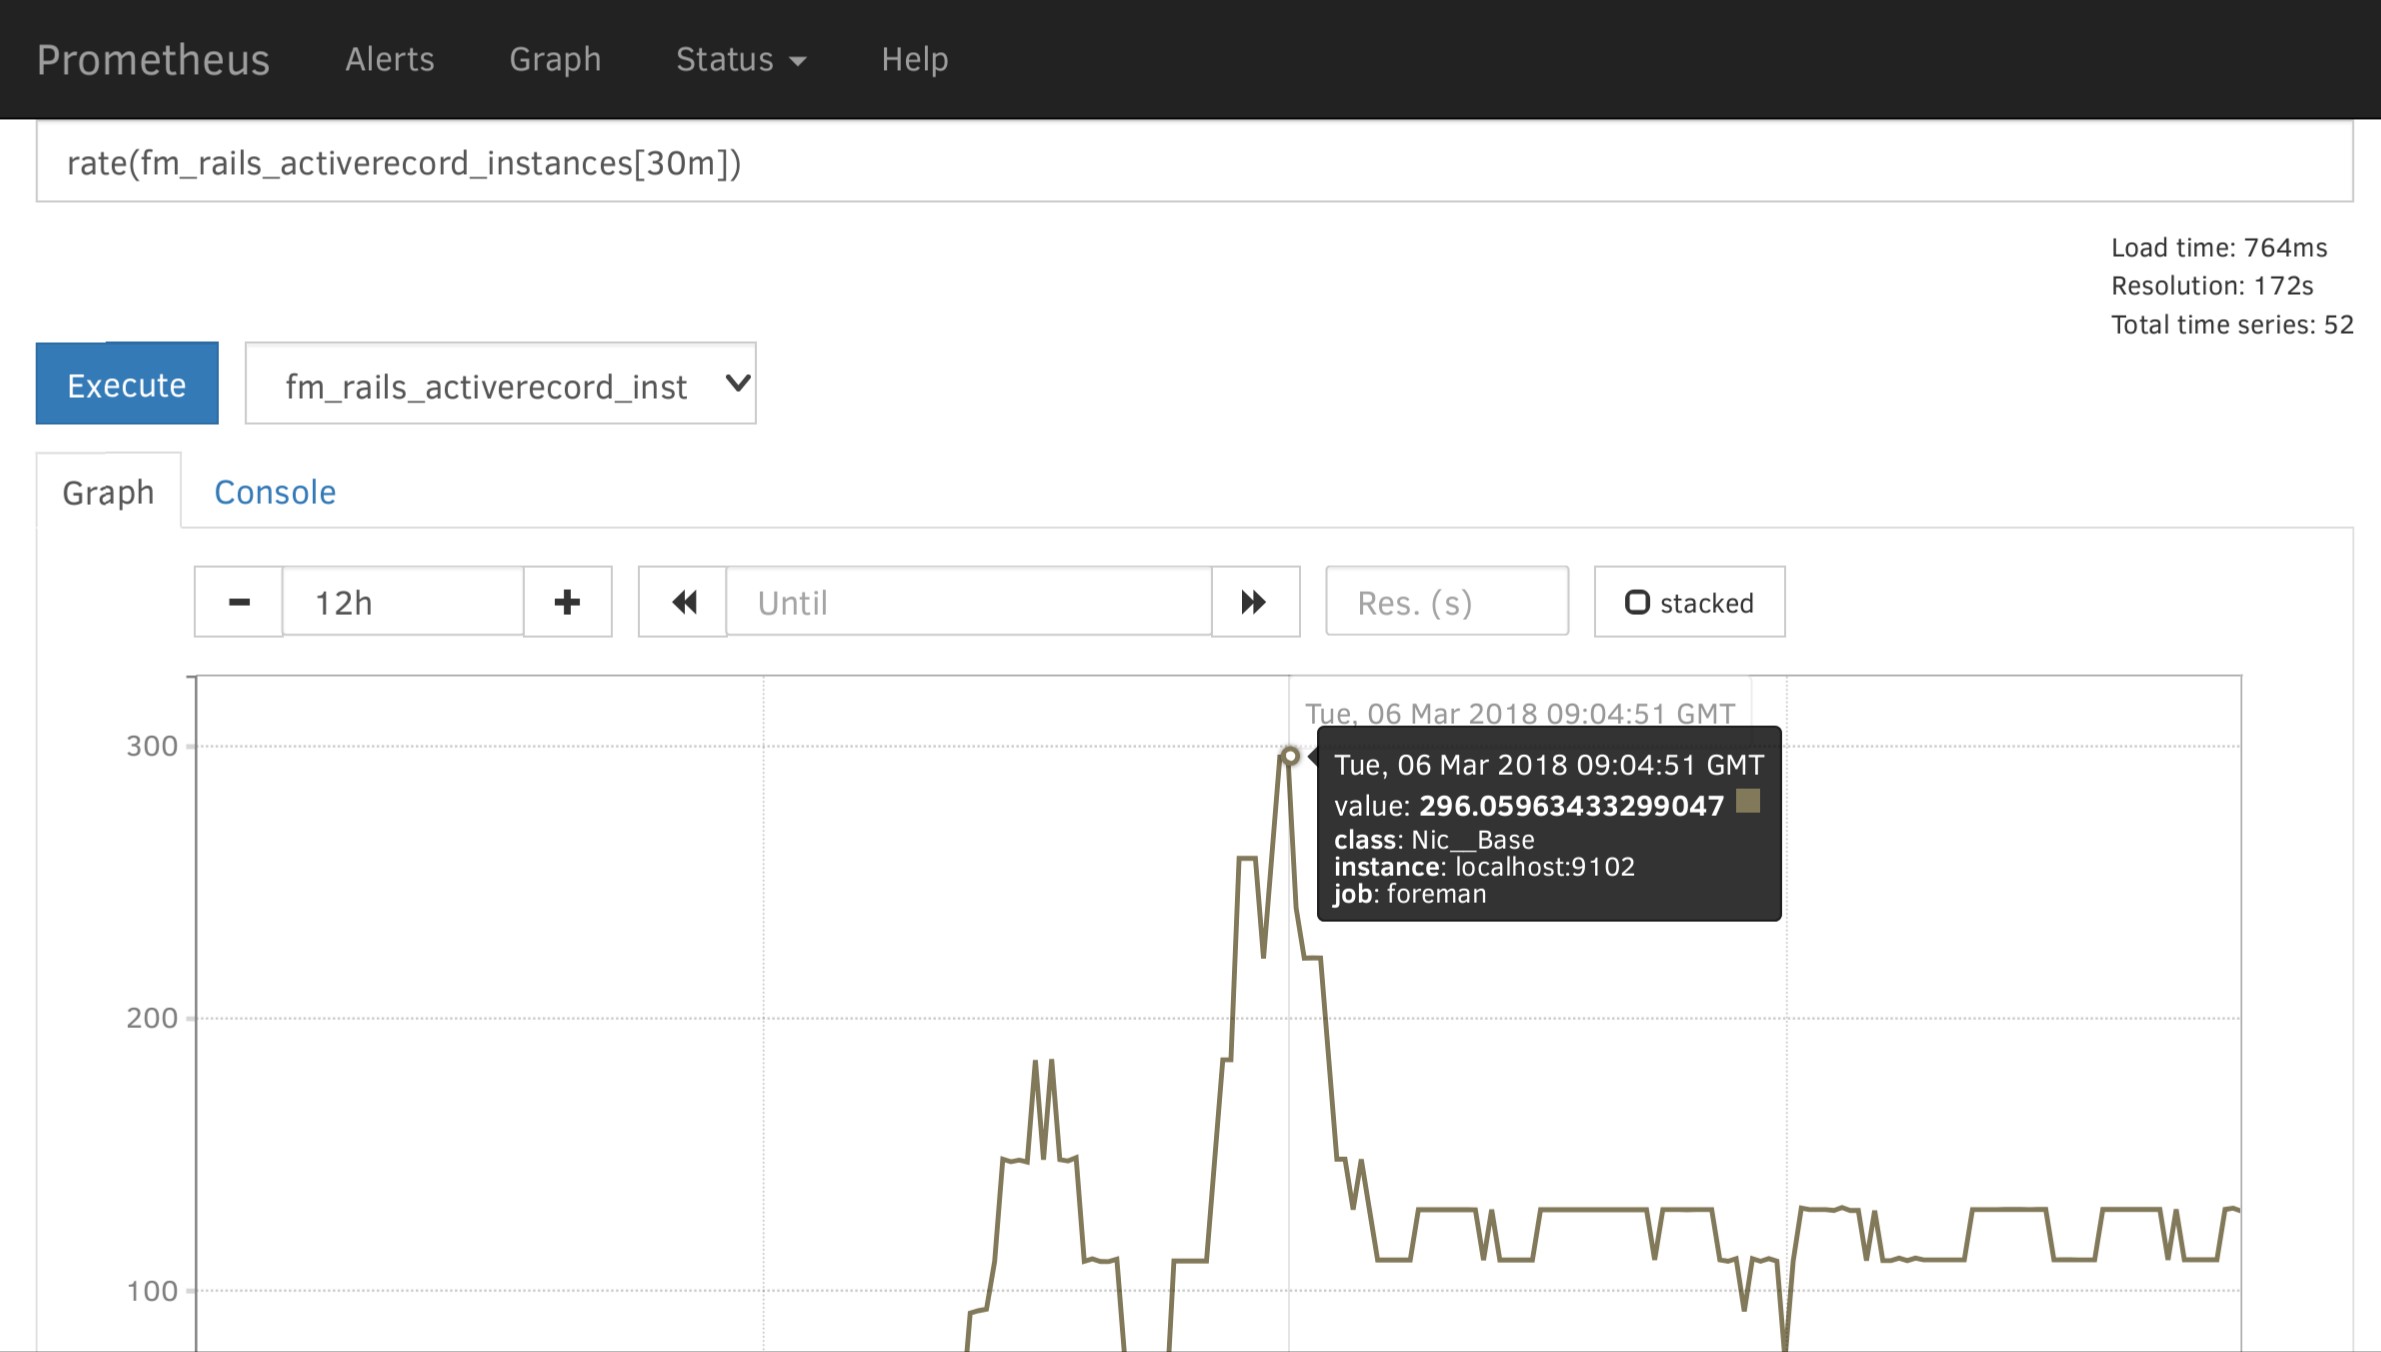
So construct Prometheus queries for those, both are counters so you can simply do average in N minute window aggregates (5, 10, 30 depending on your load). Spikes in allocations mean that we are creating too many objects, this way you should be identify ActiveRecord classes if that’s the case, or at least controller/action.
It’s hard to tell which numbers are not normal, we are all just starting with telemetry so we don’t have yet relevant data from the field. Any deviation observed is interesting.
What’s also interesting is fm_rails_http_request_total_duration which is duration (histogram), there you will find slow controllers and actions. If there is a memory leak, these actions are usually slow as well. Feel free to share graphs, numbers and tables from Prometheus once you find interesting bits.

 Thanks for pointing me towards the telemetry stuff, you answered my question without me even giving it