Help to find the bottleneck in foreman-task / remote execution

Problem:
Hello everybody,
I’m trying to increase the throughput of the remote execution and tried different things / parameters (puma worker / threads, dynflow worker / concurrency, …), but currently I’ve no idea, where the bottleneck might be.

Our current setup / configuration:

  • 4x Foreman 3.6.2 on RHEL 8.8 (installed and configured with your puppet modul).
  • every Node has 4 CPUs and 14GB Ram
  • foreman_service_puma_workers: 4, foreman_service_puma_threads_min: 8, foreman_service_puma_threads_max: 8
  • dynflow_worker_instances: 2, dynflow_worker_concurrency: 5
  • on every Node there is also a foreman-proxy with dynflow and the remote execution plugin enabled
  • ~ 2200 hosts are connected

CPU and Memory seems to be fine, under normal load we have a CPU utilization of ~5%

Current situation:
When we start a remote execution job with a simple command like “id” it took quiet a long time until all nodes are finished. Due to the setting “Allow proxy batch tasks = yes” and “Proxy tasks batch size = 100” Foreman starts the execution of the first 100 nodes (in a block), then the second 100 nodes (in a block) and so on. Mostly every node of a block switches in foreman (webfrontend) direcly to running after the block is started, but it takes a long time until such a block is finished.
On the Foreman nodes itself i cant really see a high stress situation (cpu utilization increase to ~ 25%) , mostly there are 2-5 ssh processes in parallel at the start of a block, but mostly of the time they do nothing.

As I mentioned above, I tried different parameter (puma worker / threads, dynflow worker / concurrency, …) but none of them really helped. Also I must say, that I don’t really know at what moment what components are involved in which order(starting a job → foreman tasks → dynflow?? → foreman smart proxy / remote execution proxy???)

So do you have any hints for me? Or what are the “classical” parameter to increase the throughput? Is there a way to monitor foreman-task, dynflow,…?(or doesn’t makes this really sense)
We’re sending the telemetry data through statsd to an InfluxDB / Grafana, but I didn’t find a metric, which might help.

If you need further data, let me know.

Thank you very much

tl;dr: You’re right that preparation of the job on Foreman’s side is strictly sequential. There are batches of up to 100 hosts, the batches are processed sequentially and even the hosts inside the batches are processed sequentially. From what you wrote, this is probably the bottleneck you’re looking for, but probably also something you cannot remove, unless you can somehow boost single core/single process/single thread performance.

Why four separate foreman instances?

Well, that is somewhat expected. There is an overhead associated with running jobs through foreman. For every single host in the job, it needs to verify all the necessary permissions, render the template, roll a number of per-host executions into a batch and dispatch the batch to the proxy. On my machine, id itself finishes in 0.02 seconds, but if you consider all the other things that need to happen, you get more into the seconds range per host.

Correct. To reduce the number of requests that need to be exchanged between Foreman and proxy, the nodes as you call them get prepared in batches and then each batch gets sent to the proxy in a single request. That however doesn’t mean that the batch needs to completely finish on the remote end before the next one can start.

Yes, they flip to running once they start being prepared and sit in that state until they are completely done. A larger part of sitting in running state will most likely be just waiting for the batch to be finalized so that it can be sent over to the proxy and actually executed.

Overall this feels like you’re seeing this because it finishes on the remote end so fast. If you run something that takes a long time to actually execute, you should start seeing these piling up.

If what I wrote in the tl;dr above holds, then no, not really. There are things that can be done if the other parts become the bottleneck, but not for this.

In theory you could watch https://$foreman_fqdn/foreman_tasks/sidekiq . If you see queues not being processed in time, then that is something that could be addressed.

In theory Dynflow should be able to send its own metrics to a statsd sink, but I don’t recall it being properly documented anywhere.

Just out of curiosity, could you go to the details of the job, click “Job Task” in the upper right corner, in there “Dynflow console”, in there click both the boxes under the run tab a post the data from it here?

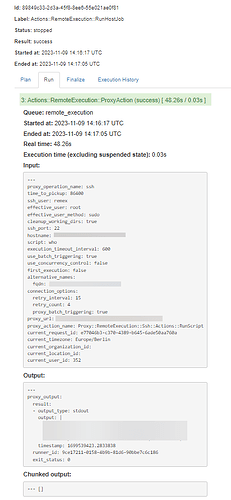
And a similar thing from first and 99th host in the job? For both of those, click the hostname in the table below, there should be a “Task” (or something along the lines of that) button, then dynflow console and screenshot the details of that?

You can redact it as much as you want, the only thing that would be interesting to see would be information about counts and times.

Hey @aruzicka
thank you for detailed response :).

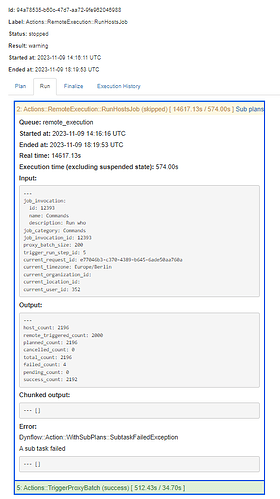
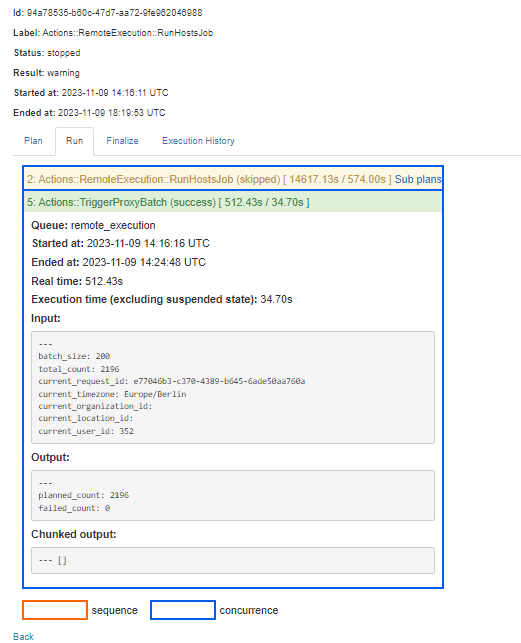
in the following screenshots you can see the details of the job / task. in the main job, there were some hosts, which were not reachable. so I think this results in a runtime of 14617.13s.
but the runtime per host (~48s) x 22 blocks is close to the actual running time.


Thank you for collecting and sharing all that. 14617 seconds is indeed not all that great, however…

Looking at the second screenshot we can see that the action that actually sends the batches out to the proxy finished in less than 10 minutes (512.43s). So more or less, within 10 minutes of you starting the job, everything should be passed on to the proxy.

Looking at the first screenshot it seems the parent task spent ~10 minutes (574.00) actively doing something and the remaining 4 or so hours just waiting for everything to finish. Now that we know this, we can say the preparation of the batches and so on isn’t exactly great, but the time spent there is negligible when compared to the rest.

There are two other places where the slowness could be coming from - the proxy and foreman when it processes that data that is coming back from the proxy.

If the proxy is the bottleneck (which is possible), you can always deploy more. Could you check how much cpu is the foreman-proxy service using when it runs? It is a single threaded process and if your nodes have 4vcpus and if it the proxy is running at 100% that would give you the ~25% cpu utilization you’re seeing.

If Foreman is not able to keep up with the data that is coming back, you should be able to see that in the sidekiq console as I described in my previous reply. You should see items piling up in queues and queue latency going up. If that’s the case, you could deploy more background workers either by following the performance tuning docs[1] to just deploy more instances of the default worker or you could follow this gist[2] I put together some time ago to spawn a worker dedicated to rex.

On a side note, you have me wondering why you have four separate foreman instances. What’s the reasoning behind that?

[1] - Tuning Performance of Foreman
[2] - Dynflow workers scaling · GitHub

hi @aruzicka,
I will do these tests in the next days.
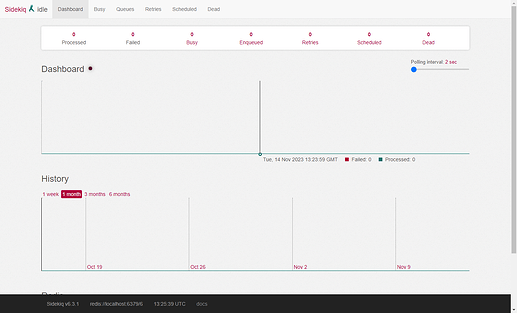
Currently there are not data shown in the sidekiq console:


By default we had “Enable dynflow console” set to No and I enabled it for the tests. Perhaps you have any hint for me to get data into it? :slight_smile:

It had different reasons in the past why we scaled up to 4 Foreman nodes. First of all we want to spread the instances over different data centers, so if one data center goes down, foreman is still running.
For daily software updates incl reboots its better for the overall performance if only 1/4 goes down at the same time in comparison to 1/2. At normal load 1/2 would perhaps be fine, but sometimes we had some “lite” burst scenarios if someone starts a lot of puppet runs in parallel.
Furthermore Foreman needed much more CPU Power in the past.

short update, figured out that after removing the following lines, data is shown below foreman_tasks/sidekiq:

/etc/foreman/settings.yaml

:dynflow:
:redis_url: redis://localhost:6379/6

there is a known connection?

Hrm, looks like things got out of sync on our side. If you run systemctl cat dynflow-sidekiq@orchestrator | grep DYNFLOW_REDIS_URL it should give you a url that should go into the file you pasted. Something tells me there should be a /0 at the end, but better check it on your box.

In the mean time, I’ll try tracking how we got into this situation.

Apparently this was an issue for some time and should be resolved in upcoming 3.9 Bug #36541: inconsistent configuration for Redis as used by Dynflow - Foreman?

Ahh ok, thanks. Seems that we’re also run into this issue. I changed the dynflow redis url and now I can see the data on all nodes :slight_smile:

Also I’ve done some tests and it seems that there is no bottleneck in Foreman (dynflow itself), no queues, retries or so. In my opinion the data from /foreman_tasks/sidekiq are quite interesting. Would be great if this data could be send to a performance monitoring tool and it’s documented some day :slight_smile:
The process of foreman-proxy do no consume more than ~40%, so this shouldn’t be the bottleneck too.

But perhaps it’s like you said, that this performance is as expected.