
Problem: Foreman server runs out of memory
Expected outcome: No memory issue
Foreman and Proxy versions: Foreman 3.1.3
Foreman and Proxy plugin versions:
foreman-tasks 5.2.3
foreman_ansible 7.0.4
foreman_bootdisk 19.0.3
foreman_cockpit 2.0.3
foreman_discovery 19.0.1
foreman_docker 5.0.0
foreman_hooks 0.3.17
foreman_opensca 5.1.1
foreman_puppet 2.0.7
foreman_remote_execution 5.0.6
foreman_snapshot_management 2.0.1
katello 4.3.1
Distribution and version:
Centos 7
Other relevant data:
I went through the process to upgrade my Foreman servers to 3.1 from 2.5.x
I went to 3.0 to 3.1 and am currently on 3.1.3.
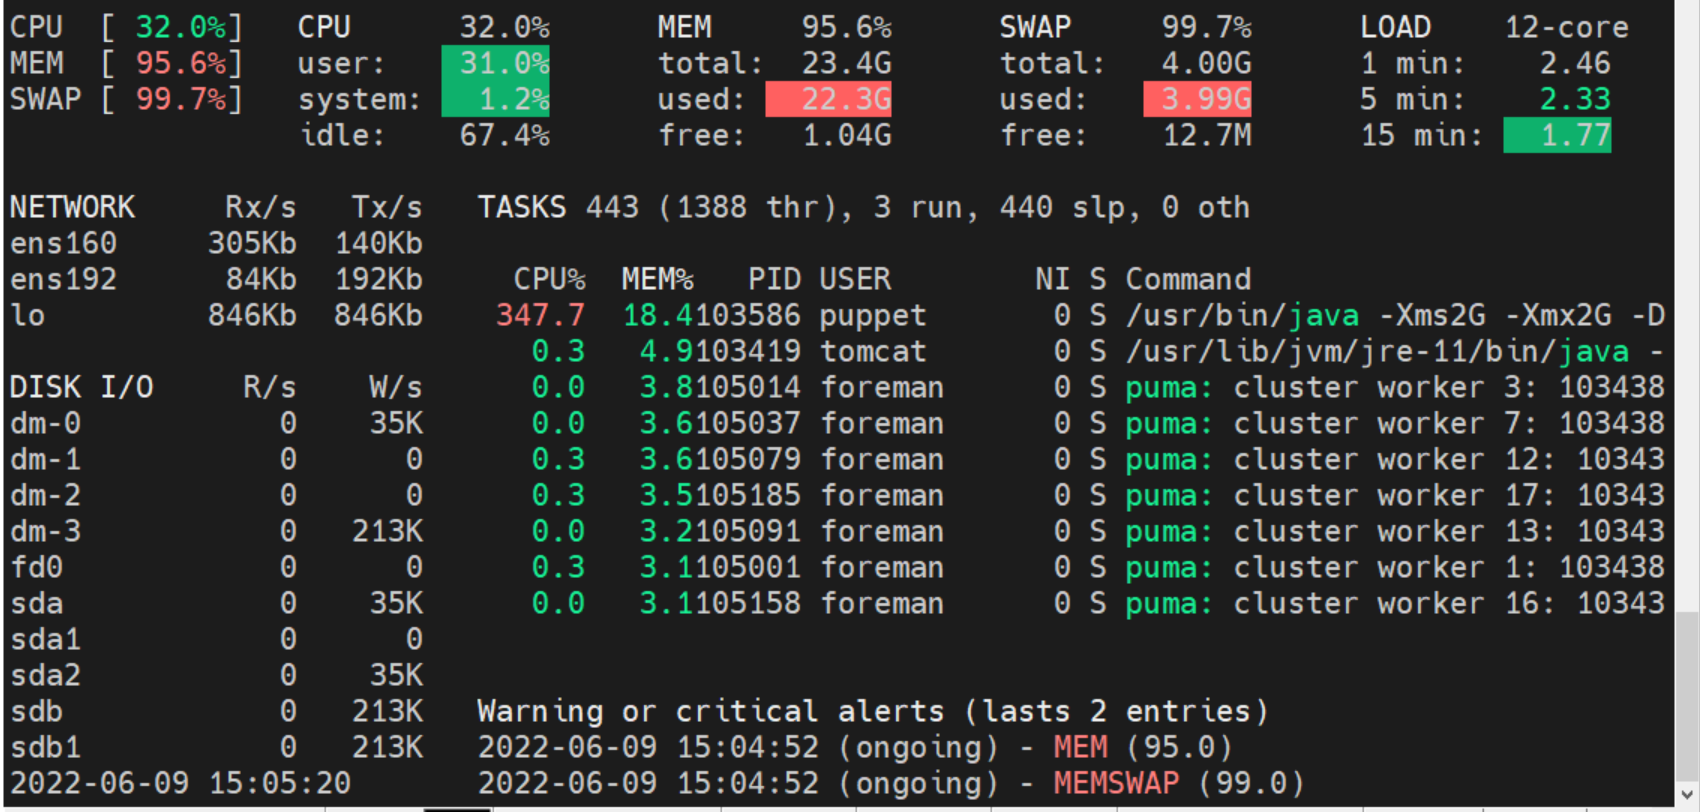
After the successful upgrade I see that the amount of ram and swap is nearly full now, I cannot find out why.
[ipa_gluciano@decdc01plcfg001 ~]$ sudo foreman-puma-status
103438 (/usr/share/foreman/tmp/puma.state) Uptime: 1d 0h | Phase: 0 | Load: 2[██░░░░░░░░░░░░░░░░░░░░░░░░░░░░░░░░░░░░░░░░░░░░░░░░░░░░░░░░░░░░░░░░░░░░░░░░░░░░░░░░░░░░░░░░]90 | Req: 141200
└ 104996 CPU: 0.0% Mem: 640 MB Uptime: 1d 0h | Load: 0[░░░░░]5 | Req: 7011
└ 105001 CPU: 0.0% Mem: 743 MB Uptime: 1d 0h | Load: 0[░░░░░]5 | Req: 14431
└ 105008 CPU: 0.0% Mem: 639 MB Uptime: 1d 0h | Load: 1[█░░░░]5 | Req: 7890
└ 105014 CPU: 0.0% Mem: 903 MB Uptime: 1d 0h | Load: 0[░░░░░]5 | Req: 3254
└ 105020 CPU: 0.0% Mem: 659 MB Uptime: 1d 0h | Load: 0[░░░░░]5 | Req: 6896
└ 105025 CPU: 0.0% Mem: 672 MB Uptime: 1d 0h | Load: 0[░░░░░]5 | Req: 9540
└ 105034 CPU: 0.0% Mem: 643 MB Uptime: 1d 0h | Load: 0[░░░░░]5 | Req: 7912
└ 105037 CPU: 0.0% Mem: 871 MB Uptime: 1d 0h | Load: 0[░░░░░]5 | Req: 12101
└ 105042 CPU: 0.0% Mem: 694 MB Uptime: 1d 0h | Load: 0[░░░░░]5 | Req: 10496
└ 105053 CPU: 0.0% Mem: 648 MB Uptime: 1d 0h | Load: 1[█░░░░]5 | Req: 5204
└ 105060 CPU: 0.0% Mem: 673 MB Uptime: 1d 0h | Load: 0[░░░░░]5 | Req: 11795
└ 105063 CPU: 0.0% Mem: 684 MB Uptime: 1d 0h | Load: 0[░░░░░]5 | Req: 4122
└ 105079 CPU: 0.0% Mem: 854 MB Uptime: 1d 0h | Load: 0[░░░░░]5 | Req: 6377
└ 105091 CPU: 0.0% Mem: 734 MB Uptime: 1d 0h | Load: 0[░░░░░]5 | Req: 6273
└ 105095 CPU: 0.0% Mem: 639 MB Uptime: 1d 0h | Load: 0[░░░░░]5 | Req: 3943
└ 105131 CPU: 0.0% Mem: 657 MB Uptime: 1d 0h | Load: 0[░░░░░]5 | Req: 5350
└ 105158 CPU: 0.0% Mem: 740 MB Uptime: 1d 0h | Load: 0[░░░░░]5 | Req: 7777
└ 105185 CPU: 0.0% Mem: 845 MB Uptime: 1d 0h | Load: 0[░░░░░]5 | Req: 10828
Are there any steps that I can take to resolve this issue? Thank you