High Memory Usage of Foreman 2.5.4

Problem: Memory usage of Foreman 2.5.4 reaches sometimes very high values for Puma workers, somewhere between ~5GB and up to ~10GB.

Foreman and Proxy versions: Foreman + Smart Proxies are on 2.5.4

Distribution and version: AlmaLinux 8.5, happens also on CentOS Linux 7.9

Other relevant data:
Hi,

I am seeing sometimes very high memory usage for Puma workers.
From the usual ~500-600MB, sometimes this peaks up to ~5GB or the record so far ~10GB:

[root@it-puppet-tfm01 ~]# foreman-puma-status
979 (/usr/share/foreman/tmp/puma.state) Uptime:  1d 1h | Phase: 0 | Load: 1[β–ˆβ–‘β–‘β–‘β–‘β–‘β–‘β–‘β–‘β–‘β–‘β–‘β–‘β–‘β–‘β–‘β–‘β–‘β–‘β–‘β–‘β–‘β–‘β–‘β–‘β–‘β–‘β–‘β–‘β–‘]30 | Req: 38463
 β””  2129 CPU:   0.0% Mem:  381 MB Uptime:  1d 1h | Load: 0[β–‘β–‘β–‘β–‘β–‘]5 | Req: 8204
 β””  2132 CPU:   0.0% Mem: 5324 MB Uptime:  1d 1h | Load: 0[β–‘β–‘β–‘β–‘β–‘]5 | Req: 6715
 β””  2136 CPU:   0.0% Mem: 5427 MB Uptime:  1d 1h | Load: 0[β–‘β–‘β–‘β–‘β–‘]5 | Req: 6921
 β””  2144 CPU:   0.0% Mem:  328 MB Uptime:  1d 1h | Load: 0[β–‘β–‘β–‘β–‘β–‘]5 | Req: 8488
 β””  2151 CPU:  13.0% Mem:  432 MB Uptime:  1d 1h | Load: 0[β–‘β–‘β–‘β–‘β–‘]5 | Req: 7877
 β”” 101124 CPU:   6.0% Mem:  420 MB Uptime:  5m45s | Load: 1[β–ˆβ–‘β–‘β–‘β–‘]5 | Req: 258

or here, from the CentOS Linux 7 instance:

[root@it-puppet-infra02 ~]# foreman-puma-status 
2121 (/usr/share/foreman/tmp/puma.state) Uptime:    11d | Phase: 0 | Load: 0[β–‘β–‘β–‘β–‘β–‘β–‘β–‘β–‘β–‘β–‘β–‘β–‘β–‘β–‘β–‘β–‘β–‘β–‘β–‘β–‘β–‘β–‘β–‘β–‘β–‘β–‘β–‘β–‘β–‘β–‘β–‘β–‘β–‘β–‘β–‘β–‘β–‘β–‘β–‘β–‘β–‘β–‘β–‘β–‘β–‘β–‘β–‘β–‘β–‘β–‘β–‘β–‘β–‘β–‘β–‘β–‘β–‘β–‘β–‘β–‘]60 | Req: 648495
 β”” 41400 CPU:  40.0% Mem: 10240 MB Uptime:  2d23h | Load: 0[β–‘β–‘β–‘β–‘β–‘]5 | Req: 156682
 β”” 41487 CPU:   0.0% Mem:  476 MB Uptime:  2d23h | Load: 0[β–‘β–‘β–‘β–‘β–‘]5 | Req: 60629
 β””  2432 CPU:   0.0% Mem: 5632 MB Uptime:  1d 0h | Load: 0[β–‘β–‘β–‘β–‘β–‘]5 | Req: 57049
 β””  2444 CPU:   0.0% Mem: 8704 MB Uptime:  1d 0h | Load: 0[β–‘β–‘β–‘β–‘β–‘]5 | Req: 56561
 β””  2450 CPU:   0.0% Mem: 10547 MB Uptime:  1d 0h | Load: 0[β–‘β–‘β–‘β–‘β–‘]5 | Req: 52630
 β””  2508 CPU:   0.0% Mem:  408 MB Uptime:  1d 0h | Load: 0[β–‘β–‘β–‘β–‘β–‘]5 | Req: 19926
 β””  2514 CPU:   0.0% Mem: 5836 MB Uptime:  1d 0h | Load: 0[β–‘β–‘β–‘β–‘β–‘]5 | Req: 46749
 β””  2838 CPU:   0.0% Mem: 5632 MB Uptime:  1d 0h | Load: 0[β–‘β–‘β–‘β–‘β–‘]5 | Req: 17305
 β”” 26121 CPU:   0.0% Mem:  619 MB Uptime: 23h12m | Load: 0[β–‘β–‘β–‘β–‘β–‘]5 | Req: 57244
 β”” 27357 CPU:   0.0% Mem:  698 MB Uptime: 23h 6m | Load: 0[β–‘β–‘β–‘β–‘β–‘]5 | Req: 53648
 β”” 27513 CPU:   0.0% Mem:  693 MB Uptime: 23h 6m | Load: 0[β–‘β–‘β–‘β–‘β–‘]5 | Req: 57199
 β”” 30274 CPU:   0.0% Mem:  530 MB Uptime: 22h55m | Load: 0[β–‘β–‘β–‘β–‘β–‘]5 | Req: 12873

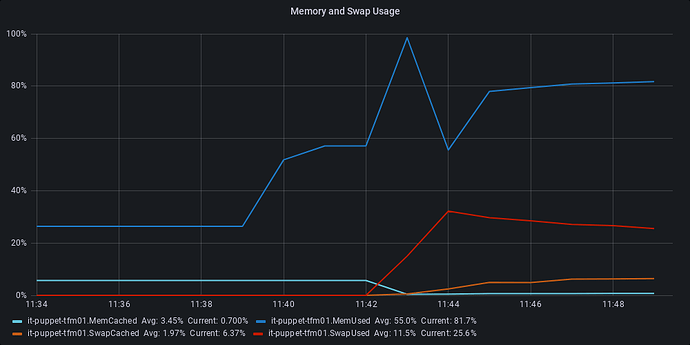
From the memory plot, it goes up in steps:

I am seeing this issue on both CentOS Linux 7.9 and AlmaLinux 8.5, so this seems to be independent of the operating system.

I tried to grep for high Allocations, most of the time it seems to be overview URL, which correlates to the time of the memory usage peak:

[root@it-puppet-tfm01 ~]# grep 00e8ff05 /var/log/foreman/production.log
2021-12-03T11:40:22 [I|app|00e8ff05] Started GET "/hosts/hasfcons14.desy.de/overview" for xxx.xxx.xxx.xxx at 2021-12-03 11:40:22 +0100
2021-12-03T11:40:22 [I|app|00e8ff05] Processing by HostsController#overview as HTML
2021-12-03T11:40:22 [I|app|00e8ff05]   Parameters: {"id"=>"hasfcons14.desy.de"}
2021-12-03T11:43:07 [I|app|00e8ff05]   Rendered hosts/_overview.html.erb (Duration: 165212.0ms | Allocations: 23968960)
2021-12-03T11:43:07 [I|app|00e8ff05] Completed 200 OK in 165247ms (Views: 157367.8ms | ActiveRecord: 7852.8ms | Allocations: 23976488)

[root@it-puppet-tfm01 ~]# grep 6cba0518 /var/log/foreman/production.log
2021-12-03T11:43:06 [I|app|6cba0518] Started GET "/hosts/batch1301.desy.de/overview" for xxx.xxx.xxx.xxx at 2021-12-03 11:43:06 +0100
2021-12-03T11:43:06 [I|app|6cba0518] Processing by HostsController#overview as HTML
2021-12-03T11:43:06 [I|app|6cba0518]   Parameters: {"id"=>"batch1301.desy.de"}
2021-12-03T11:45:50 [I|app|6cba0518]   Rendered hosts/_overview.html.erb (Duration: 164198.7ms | Allocations: 23226182)
2021-12-03T11:45:50 [I|app|6cba0518] Completed 200 OK in 164251ms (Views: 157231.9ms | ActiveRecord: 6989.2ms | Allocations: 23241033)

[root@it-puppet-tfm01 ~]# grep 16974d1d /var/log/foreman/production.log
2021-12-03T11:44:43 [I|app|16974d1d] Started GET "/hosts/batch1302.desy.de/overview" for xxx.xxx.xxx.xxx at 2021-12-03 11:44:43 +0100
2021-12-03T11:44:43 [I|app|16974d1d] Processing by HostsController#overview as HTML
2021-12-03T11:44:43 [I|app|16974d1d]   Parameters: {"id"=>"batch1302.desy.de"}
2021-12-03T11:47:26 [I|app|16974d1d]   Rendered hosts/_overview.html.erb (Duration: 162800.0ms | Allocations: 23383184)
2021-12-03T11:47:26 [I|app|16974d1d] Completed 200 OK in 162866ms (Views: 148853.1ms | ActiveRecord: 13968.1ms | Allocations: 23391034)

I had a look at those hosts, they do not have many NICs or parameters configured, which would explain this.

The Foreman instance is rather plain, aside from the PuppetDB Plugin, no plugins are installed. Multiple Puppet Servers use this instance as an ENC, and upload facts/reports. Overall ~6100 nodes are inside this instance.
It looks a bit like this issue 33585, but parameters are only rarely used.

I can not really point out the exact time, when this issue started to appear.
From the historic memory plots, the issue started to appear after upgrading from Foreman 2.5.0 β†’ 2.5.2. Later it has been upgraded from 2.5.2 β†’ 2.5.4, but this did not change anything wrt. memory consumption.

Does anybody have some ideas how to debug this further? I am planning to setup the StatsD to Prometheus to get some additional metrics.

Regards,
Stefan

1 Like

Hey Stefan, excellent analysis, hopefully we can figure it out. You isolated it pretty nicely, overview action is pretty narrow down. Let me peek into the codebase to find out more.

The mentioned Increased memory on 2.5 with smart class params thread hasn’t been resolved yet.

In the meantime, could you enable reporting of slow SQL queries in PopstgreSQL? Let’s say report everything slower than 5000 ms. Then try to reproduce this bug (hit this in the UI) and paste bin those SQL queries.

It looks like database is not the culprit, the offender is Ruby obviously, however, I am interested what kind of data takes so slow to load.

Also please run this:

foreman-rake console
> UI.host_descriptions

> UI::HostDescription.reduce_providers(:overview_fields)

Also report how fast these commands were. Thanks.

Can you apply the following patch in /usr/share/foreman

diff --git a/app/helpers/hosts_helper.rb b/app/helpers/hosts_helper.rb
index 94997051a..228635e14 100644
--- a/app/helpers/hosts_helper.rb
+++ b/app/helpers/hosts_helper.rb
@@ -250,9 +250,20 @@ module HostsHelper
   def overview_fields(host)
     fields = []
     UI::HostDescription.reduce_providers(:overview_fields).each do |provider|
+      starting = Process.clock_gettime(Process::CLOCK_MONOTONIC)
       fields += send(provider, host)
+      ending = Process.clock_gettime(Process::CLOCK_MONOTONIC)
+      elapsed = ending - starting
+      Rails.logger.warn("Processing overview_field #{provider} took #{(elapsed / 1000).round(4)} ms")
     end
-    prioritized_members(fields, :field)
+    Rails.logger.warn("Generated #{fields.count} fields")
+    starting = Process.clock_gettime(Process::CLOCK_MONOTONIC)
+    result = prioritized_members(fields, :field)
+    ending = Process.clock_gettime(Process::CLOCK_MONOTONIC)
+    elapsed = ending - starting
+    Rails.logger.warn("Sorting took #{(elapsed / 1000).round(4)} ms")
+    Rails.logger.warn("And the result is: #{result}")
+    result
   end

   def possible_images(cr, arch = nil, os = nil)

Restart, reproduce the problem and pastebin the log. It should look something like:

2021-12-03T13:49:07 [I|app|1c3793fb] Started GET "/hosts/report.example.com/overview" for ::ffff:192.168.1.3 at 2021-12-03 13:49:07 +0100
2021-12-03T13:49:07 [I|app|1c3793fb] Processing by HostsController#overview as HTML
2021-12-03T13:49:07 [I|app|1c3793fb]   Parameters: {"id"=>"report.example.com"}
2021-12-03T13:49:07 [I|per|1c3793fb] Current user set to admin (admin)
2021-12-03T13:49:07 [D|tax|1c3793fb] Current location set to none
2021-12-03T13:49:07 [D|tax|1c3793fb] Current organization set to MyOrg
2021-12-03T13:49:08 [W|app|1c3793fb] Processing overview_field base_status_overview_fields took 0.0001 ms
2021-12-03T13:49:08 [W|app|1c3793fb] Processing overview_field base_host_overview_fields took 0.0002 ms
2021-12-03T13:49:08 [W|app|1c3793fb] Processing overview_field puppet_host_overview_fields took 0.0 ms
2021-12-03T13:49:08 [W|app|1c3793fb] Generated 13 fields
2021-12-03T13:49:08 [W|app|1c3793fb] Sorting took 0.0 ms
2021-12-03T13:49:08 [W|app|1c3793fb] And the result is: [["Status", "<span class=\"host-status pficon-ok status-ok\"></span><span class=\"status-ok\">OK</span>"], ["Build", "<span class=\"host-status pficon-ok status-ok\"> </span><span class=\"status-ok\">Installed</span><span><a class=\"pull-right\" rel=\"nofollow\" data-method=\"post\" href=\"/hosts/report.example.com/forget_status?status=1\">clear</a></span>"], ["Build duration", "N/A"], ["Token", "N/A"], ["Domain", "<a href=\"/hosts?search=domain+%3D+example.com\">example.com</a>"], ["MAC Address", "aa:bb:cc:dd:ee:ff"], ["Architecture", "<a href=\"/hosts?search=architecture+%3D+x86_64\">x86_64</a>"], ["Operating System", "<a href=\"/hosts?search=os_title+%3D+%22Debian+10%22\">Debian 10</a>"], ["PXE Loader", nil], ["Boot time", "Not reported"], ["Location", "<a href=\"/hosts?search=location+%3D+%22MyLoc%22\">MyLoc</a>"], ["Organization", "<a href=\"/hosts?search=organization+%3D+%22MyOrg%22\">MyOrg</a>"], ["Owner", "<a href=\"/hosts?search=user.login+%3D+%22admin%22\">Admin User</a>"]]
2021-12-03T13:49:08 [I|app|1c3793fb]   Rendered hosts/_overview.html.erb (Duration: 271.8ms | Allocations: 178200)
2021-12-03T13:49:08 [I|app|1c3793fb] Completed 200 OK in 577ms (Views: 247.1ms | ActiveRecord: 144.2ms | Allocations: 403818)

That should find the offender I think.

The output from the foreman-rake console is here: foreman-rake console - Pastebin.com
There was no delay in the output, it was instantaneous.

I have enabled the slow query logging and applied your patch. So it’s waiting until I am hitting it again, should not take that much time hopefully.

Thanks for the quick answers!

Hit the issue again and got the data:
pastebin: Foreman production.log
pastebin: PostgreSQL Slow Query

Memory consumption jumped from ~800MB to 5.7GB:

# foreman-puma-status 
191833 (/usr/share/foreman/tmp/puma.state) Uptime:  2d10h | Phase: 0 | Load: 2[β–ˆβ–ˆβ–‘β–‘β–‘β–‘β–‘β–‘β–‘β–‘β–‘β–‘β–‘β–‘β–‘β–‘β–‘β–‘β–‘β–‘β–‘β–‘β–‘β–‘β–‘β–‘β–‘β–‘β–‘β–‘]30 | Req: 1154271
 β”” 191881 CPU: 100.0% Mem:  789 MB Uptime:  2d10h | Load: 2[β–ˆβ–ˆβ–‘β–‘β–‘]5 | Req: 191588
 β”” 191885 CPU:   6.0% Mem:  800 MB Uptime:  2d10h | Load: 0[β–‘β–‘β–‘β–‘β–‘]5 | Req: 185369
 β”” 191890 CPU:   0.0% Mem: 5734 MB Uptime:  2d10h | Load: 0[β–‘β–‘β–‘β–‘β–‘]5 | Req: 191450
 β”” 191895 CPU:   0.0% Mem:  724 MB Uptime:  2d10h | Load: 0[β–‘β–‘β–‘β–‘β–‘]5 | Req: 188499
 β”” 191903 CPU:   0.0% Mem:  778 MB Uptime:  2d10h | Load: 0[β–‘β–‘β–‘β–‘β–‘]5 | Req: 197541
 β”” 191907 CPU:   0.0% Mem:  806 MB Uptime:  2d10h | Load: 0[β–‘β–‘β–‘β–‘β–‘]5 | Req: 199824

Looks like for some reason the overview loads all the config reports from the database to memory, although i’m having a difficult time finding where that query comes from.

Is it possible some custom patches have been applied to this instance (other than the one suggested by @lzap above)? there haven’t been any changes touching the host detail page or config report handling between 2.5.0 and 2.5.2, and i’m not finding any code path that can lead to triggering this query.

Another option to try and identify the source of this query is to add

  config.active_record.verbose_query_logs = Foreman::Logging.logger('sql')

in /usr/share/foreman/config/environments/production.rb inside the config block and enable the sql logger in /etc/foreman/settings.yaml, but keep in mind this will quickly make the logs much larger as all sql queries will be logged along with their origins.
If you could enable this logging and visit one of the problematic host details pages it would hopefully point us to the offender.

1 Like

Yeah, the slow postgresql query looks like it matches the actual DB time reported by RoR:

SELECT "reports".* FROM "reports" WHERE "reports"."type" = $1

So we are loading up all reports into memory to throw them away? I don’t get where we would be loading reports, the controller code is so simple:

    def overview
      render :partial => 'overview', :locals => { :host => @host }
    rescue ActionView::Template::Error => exception
      process_ajax_error exception, 'fetch overview information'
    end

Omg I made a bug, impossible!

Can you rewrite elapsed / 1000 as elapsed * 1000 and re-share the results? Note there are two occurrences in the patch. Of course it showed zero milliseconds it was a pretty bad math! :slight_smile:

no, aside from the patch from this thread, nothing else has been patched. Please note, I am not 100% sure, that the problem appeared between 2.5.0 β†’ 2.5.2. That’s only an assumption from the historic memory plots :frowning:

woah, I can finally reproduce this on my own :grinning: I was always working with full administrator privileges. Impersonated the user and voila, I can reproduce this now.
With sql logging enabled, I was able to find this request: production.log with sql - Pastebin.com
I can also share the full log, but I need to check for any sensitive information first.

This means I no longer have to wait until it happens! I can easily disable one from the two Foreman instances in the loadbalancer for any debugging measures without affecting or noise from production.

And we have a winner, from the authorizer code:

2021-12-06T12:02:51 [D|sql|330e8a5e]   ConfigReport Load (6255.7ms)  SELECT "reports".* FROM "reports" WHERE "reports"."type" = $1  [["type", "ConfigReport"]]
2021-12-06T12:02:51 [D|sql|330e8a5e]   ↳ app/services/authorizer_cache.rb:12:in `include?'

What are the permissions for the user that cause this issue to trigger?

I think I have identified the root cause, looks like we are needlessly loading all authorized resources to memory when checking for user permissions. I’ve opened a PR to try and resolve this, it should also apply cleanly to 2.5 if you wish to test it on your instance:

https://github.com/theforeman/foreman/pull/8972

1 Like

The user is limited to a single org and has a single role, with 2 overrides. That’s the output from hammer.
We have ~37 organizations, many but not all users have this role.

I applied the patch and I can confirm, the issue is gone! The overview table now loads quickly and memory consumption stays on a normal level :hugs: Thanks!
Is there any more data you would like to have or see?

1 Like

Thanks for the feedback! as you can see from the discussion on the PR, we are debating a possible different implementation, since the current proposal might cause issues elsewhere, so we might want to test another version if that would be possible for you.
BTW, how many ConfigReports do you have in the system?

1 Like

Would it be possible to test the performance with this implementation instead:

  def collection_cache_lookup(subject, permission)
    collection = @cache[subject.class.to_sym][permission.to_sym] ||=
      find_collection(subject.class, :permission => permission).pluck(:id)

    collection.include?(subject.id)
  end

Sure, just tried it, but it fails with ActionView::Template::Error: undefined method to_sym.
I replaced the to_sym with to_s and that works, but I am by no means an Ruby export…

It works and memory usage stays normal, but is slower. See below for the response times for all variants:

# Unpatched
2021-12-06T16:09:44 [I|app|92cf21d3] Completed 200 OK in 131688ms (Views: 125218.5ms | ActiveRecord: 6384.4ms | Allocations: 24370383)

# 1st patch
2021-12-06T16:11:00 [I|app|f1d2cebb] Completed 200 OK in 255ms (Views: 119.4ms | ActiveRecord: 30.6ms | Allocations: 93855)

# 2nd patch
2021-12-06T16:12:55 [I|app|a2a855df] Completed 200 OK in 2395ms (Views: 1472.1ms | ActiveRecord: 851.4ms | Allocations: 1712877)

In case this will be relevant, we are using a remote PostgreSQL instance for Foreman, the database is running on a dedicated host.

I hope the raw number from PostgreSQL is fine:

foreman=# select count(id) from reports;
  count  
---------
 1624177
(1 row)
2 Likes

Thanks for the data, this is super useful!
The 1.7M allocations in the second patch is inline with the 1.6M reports you have, since we only load the report IDs there and not the whole ActiveRecord object (which seem to allocate about 15 objects each).

Could you try similarly checking the hosts index page with all three versions with per_page set to 100? it would give us some indication if the speedup of not loading any records to memory is still worth it when we run multiple permission checks for different resources (the host index page run 2 or 3 checks per host)

1 Like

Ran it again for GET "/hosts?per_page=100":

# Unpatched
2021-12-06T17:05:53 [I|app|ac2004af] Completed 200 OK in 405ms (Views: 300.3ms | ActiveRecord: 54.0ms | Allocations: 195152)

# 1st patch
2021-12-06T17:07:21 [I|app|51b57292] Completed 200 OK in 805ms (Views: 597.6ms | ActiveRecord: 142.2ms | Allocations: 384168)

# 2nd patch
2021-12-06T17:09:16 [I|app|04571d52] Completed 200 OK in 534ms (Views: 338.2ms | ActiveRecord: 85.8ms | Allocations: 237021)

100 is also our configured value for Settings β†’ General β†’ entries_per_page