Problem:
Hosts that have performed puppet runs regularly (more recently than out-of-sync interval) via the puppet service show as “out-of-sync” in the host status, both in UI and via API (api/hosts/:id/status/configuration):
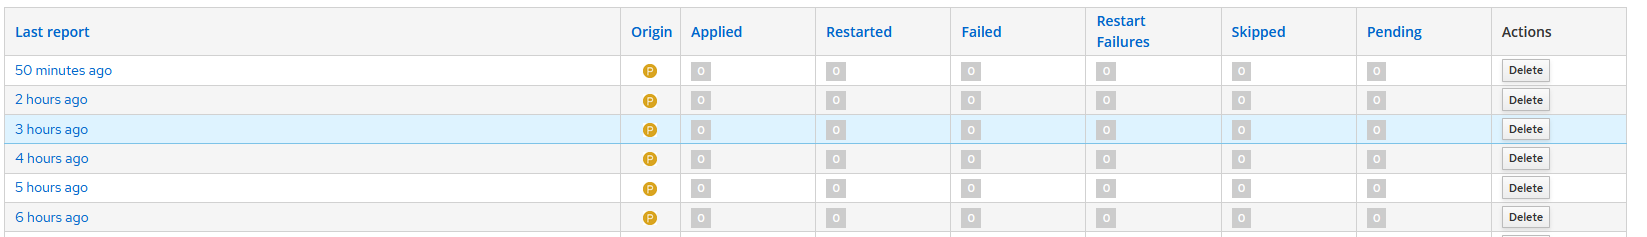
Yet, there are Puppet reports processed for the hosts regularly:
We have Puppet configured to run hourly and out-of-sync interval is set to 70 minutes.
The hosts do not show as out of sync in the dashboard widget with “last_report < “70 minutes ago” and status.enabled = true” search query and do not have alerts disabled.
The status turns to “No changes” when I trigger a manual puppet run via puppet agent -t on that host, but changes back to “out-of-sync” after the out-of-sync interval.
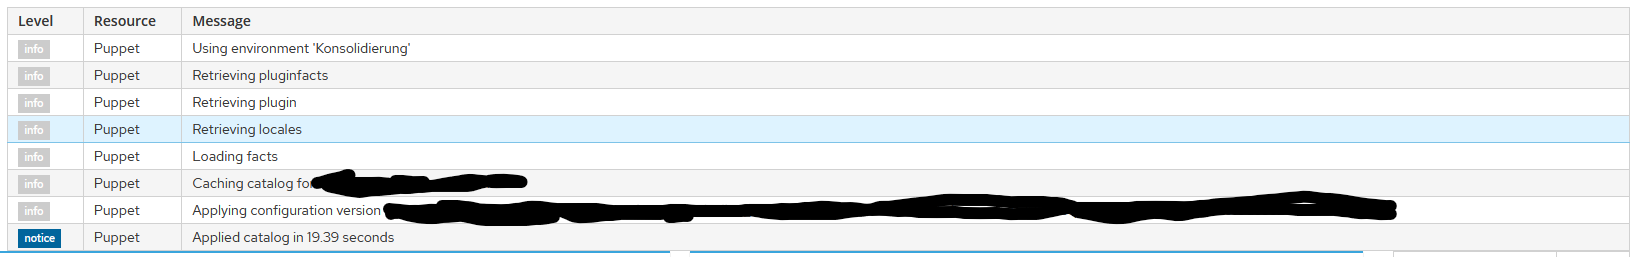
The only difference that I noticed is that puppet runs triggered from the agent service only contain the line “Applied catalog in X.Y seconds”, while runs from puppet agent -t contain some more info lines:
--test is a combination of multiple other options:
* --test:
  Enable the most common options used for testing. These are 'onetime',
  'verbose', 'no-daemonize', 'no-usecacheonfailure', 'detailed-exitcodes',
  'no-splay', and 'show_diff'.
Thus, you’ll see verbose output if you are using --test.
Did you set the puppet_interval setting accordingly?
Yes, I know. I am not surprised, that the --test runs have more verbose output, just wanted to point out that the this resulted in more messages in the report as well.
Yes, both puppet_interval and out_of_sync_interval are set to 70.
We have not touched any of these settings in a long time, and it has worked in the past.
Hi, If I remember correctly, it was something about katello becoming incompatible, deprecated or something. It’s anoying.
having that randomly also. Setting the out of sync to a bigger # than puppet interval may help.
In fact, it looks like I may have misinterpreted the behavior (or just picked bad samples).
I have now observed that the runs triggered by the agent service in fact do cause a “no changes” status, but that only lasts for about 10 minutes and then changes to “out-of-sync”, despite both intervals are set to 70 minutes.
Runs triggered manually via “puppet agent -t” just keep the “no changes” status longer, for what I assume is in fact the out-of-sync-interval setting.
I have tried reverting that patch on our test Foreman, and it in fact looks like the issue I see is related to that change. Once I reverted to the previous state, hosts show as “No Changes” again correctly. After restoring the state as “shipped” in 3.2, the hosts returned to “out of sync” again.
So it looks like something causes Foreman to think the outofsync_interval should be 10 Minutes instead of the configured 70 for reports that only contain the “Applied catalog in X.Y seconds” line.
I took a closer look at the code and added some log statements for debugging.
It appears to me that patch only revealed another underlying problem. From what I see, it appears that last_report actually picks up the second-to-last report.
The host I am currently looking at has it’s last reports at 11:16, 11:13 and 10:32 AM all in UTC+1.
I added a log statement that gives me the time of the last report compared to the time for outofsync calculation. For that, I patched the out_of_sync? function in configuration_status.rb to look like this:
    def out_of_sync?
      if (host && !host.enabled?) || no_reports? || out_of_sync_disabled?
        false
      else
        !reported_at.nil? && logger.error {"reported_at: #{reported_at} oos at: #{(Time.now.utc - expected_report_interval)}"} && reported_at < (Time.now.utc - expected_report_interval)
      end
    end
If I call the hosts details page with that, I get the following output in the log:
reported_at: 2023-01-11 11:13:03 +0100 oos at: 2023-01-11 09:10:57 UTC
Before I triggered the 11:16 puppet run, I got reported_at as 10:32 UTC+1 and before that it was 09:32 UTC+1. So it never actually checks the most current report, but the report before that.
Since out Puppet agents are set up to run once an hour, and the puppet_outofsync interval is set to 70 minutes, that explaines the behaviour I observed. Manually triggered Puppet runs are not processed differently, the just add another report so a report within the configured timeframe is processed as last_report.
Before the patch you linked, the interval that was checked for outofsync was just higher (due to adding puppet_interval and outofsync interval), which did hide this problem by (in our case) doubling the out of sync time to 2:20 hours.
Any idea if this is a known bug? I remember there was a reason for this particular implementation of the out-of-sync-interval. However, there was also the agreement that it needs cleanup
The time of the last_report_object is correct, although it was converted to UTC from UTC+1, obviously during report processing since the times in the DB are the UTC ones:
foreman=# select id, host_id, reported_at, type, origin from reports where host_id = 3026 order by id desc;
   id    | host_id |     reported_at     |     type     | origin
---------+---------+---------------------+--------------+--------
 1890961 |    3026 | 2023-01-12 10:43:27 | ConfigReport | Puppet
 1890944 |    3026 | 2023-01-12 10:32:53 | ConfigReport | Puppet
 1890861 |    3026 | 2023-01-12 09:32:53 | ConfigReport | Puppet
...
So is this a TZ issue? Like we drop the TZ somewhere on the way and therefore comparing wrong report date? That would explain why it wasn’t seen by more users.
I don’t know what happened, but I just took another look and the problem just disappeared.
We had some maintenance this weekend (RHEL8 upgrade, migration to shellhooks from foreman_hooks), but I doubt that is related since the testing environment was also affected and that had those changes already applied when we first encountered this problem.
Unsatisfying to not know what caused this and how it went away, but at least it’s gone for now-