@John_Beranek regarding the puma worker that’s using a lot of memory, can you check this from your server via foreman-rake? Katello::EventDaemon::Runner.pid ? Let me know if the PID it reports matches the high memory puma worker on your system.
Thank you. Next time you see the memory going high please share the output of hammer ping - especially the *_events parts. Maybe I can tell which event handler is causing the high usage
Jonathon, can you explain me why the process is named just rails? Puma processes should be always named puma since puma app server calls setproctitle to modify process title.
I am trying to identify all processes we have on Katello deployment:
I believe it should be pretty easy for Katello Event Daemon to set process title to something reasonable.
OK, so I have a puma process which has reached 11GiB resident, and:
# hammer ping
database:
    Status:          ok
    Server Response: Duration: 0ms
katello_agent:
    Status:          FAIL
    message:         Not running
    Server Response: Duration: 0ms
candlepin:
    Status:          ok
    Server Response: Duration: 17ms
candlepin_auth:
    Status:          ok
    Server Response: Duration: 17ms
candlepin_events:
    Status:          ok
    message:         57949 Processed, 0 Failed
    Server Response: Duration: 0ms
katello_events:
    Status:          ok
    message:         40 Processed, 0 Failed
    Server Response: Duration: 0ms
pulp3:
    Status:          ok
    Server Response: Duration: 68ms
foreman_tasks:
    Status:          ok
    Server Response: Duration: 36ms
# journalctl --no-hostname -S "7 days ago" |fgrep "Out of memory"
Nov 28 02:00:46 kernel: Out of memory: Killed process 1710529 (ebpf.plugin) total-vm:394528kB, anon-rss:153800kB, file-rss:0kB, shmem-rss:560kB, UID:987 pgtables:604kB oom_score_adj:1000
Nov 28 02:01:34 kernel: Out of memory: Killed process 1710320 (netdata) total-vm:243972kB, anon-rss:120264kB, file-rss:0kB, shmem-rss:560kB, UID:987 pgtables:412kB oom_score_adj:1000
Dec 01 03:03:12 kernel: Out of memory: Killed process 3026521 (netdata) total-vm:237880kB, anon-rss:121628kB, file-rss:0kB, shmem-rss:560kB, UID:987 pgtables:400kB oom_score_adj:1000
Dec 01 03:04:23 kernel: Out of memory: Killed process 4035985 (netdata) total-vm:168932kB, anon-rss:77416kB, file-rss:0kB, shmem-rss:556kB, UID:987 pgtables:264kB oom_score_adj:1000
Dec 01 03:04:23 kernel: Out of memory: Killed process 3026536 (rails) total-vm:16762388kB, anon-rss:15458220kB, file-rss:0kB, shmem-rss:0kB, UID:994 pgtables:32396kB oom_score_adj:0
[Edit: In fact, the killed PID above matches the last time I provided the EventDaemon’s PID.]
So, it’s only just ‘rails’ when the kernel’s OOM-killer comes along - presumably the kernel wants to only output the original process name, and not the dynamically set one?
What we see (one of the worker processes - selected randomly?) is handling the events feels weird to me. I’ve created a lengthy post about this:
That is a larger problem on its own, this is why I created separate post. I will let Katello devs to investigate and help you in this one.
@Jonathon_Turel remember we have a nice telemetry API in Foreman core which is not utilized at all for Katello events. It is extremely easy to add statements to monitor amount of events, events per minute, length of queues and other important metrics which could help.
What would be also possible to call Ruby VM stat before and after each event is processed and make a reading of amount of allocated objects. This can be reported per event and easily aggregated later.
Here is a reminder to use our telemetry API for such information: Foreman telemetry API for developers
Yes, title set via setproctitle are only read by some tools like ps or top.
I noticed that katello_agent is FAIL in your hammer ping output. Do you use katello agent in your infrastructure? If not, you should run the installer with --foreman-proxy-content-enable-katello-agent=false
Hi, I just found this topic,
I face the same problem as John, such as those errors when syncing :
Nov 17 09:17:41 katello.example.com pulpcore-worker-7[3775518]: django.db.models.deletion.ProtectedError: ("Cannot delete some instances of model 'ReservedResource' because they are referenced through a protected foreign key: 'TaskReservedResource.resource'",>
Nov 17 09:17:42 katello.example.com pulpcore-api[3277945]: pulp [89e5995c-3b2b-437a-b367-4faf9c981c39]:  - - [17/Nov/2021:09:17:42 +0000] "GET /pulp/api/v3/tasks/039e13b0-5a99-4f8c-9906-14818f48a8d6/ HTTP/1.1" 200 1411 "-" "OpenAPI-Generator/3.14.1/ruby"
The same hammer ping result with “katello_agent” as failed even though we’ve never used katello agent, and the same qpidd errors in the journal.
I suspect that you and the OP have upgraded from older version of Katello where the Katello Agent infrastructure is enabled by default. New installations do not do so. If you aren’t using it then I absolutely recommend running the installer as I mentioned to remove all traces of Katello Agent from your server.
That installer option is --foreman-proxy-content-enable-katello-agent=false
If you are on pulpcore 3.14 and are not explicitly opting into the old tasking system, it is safe to delete the records in the “core_taskreservedresource” table (that is - DELETE FROM core_taskreservedresource; ), which should resolve the issue. They are leftovers from the old tasking system which for some reason have not been cleaned up properly.
@John_Beranek Did this a few days ago, he should be able to confirm.
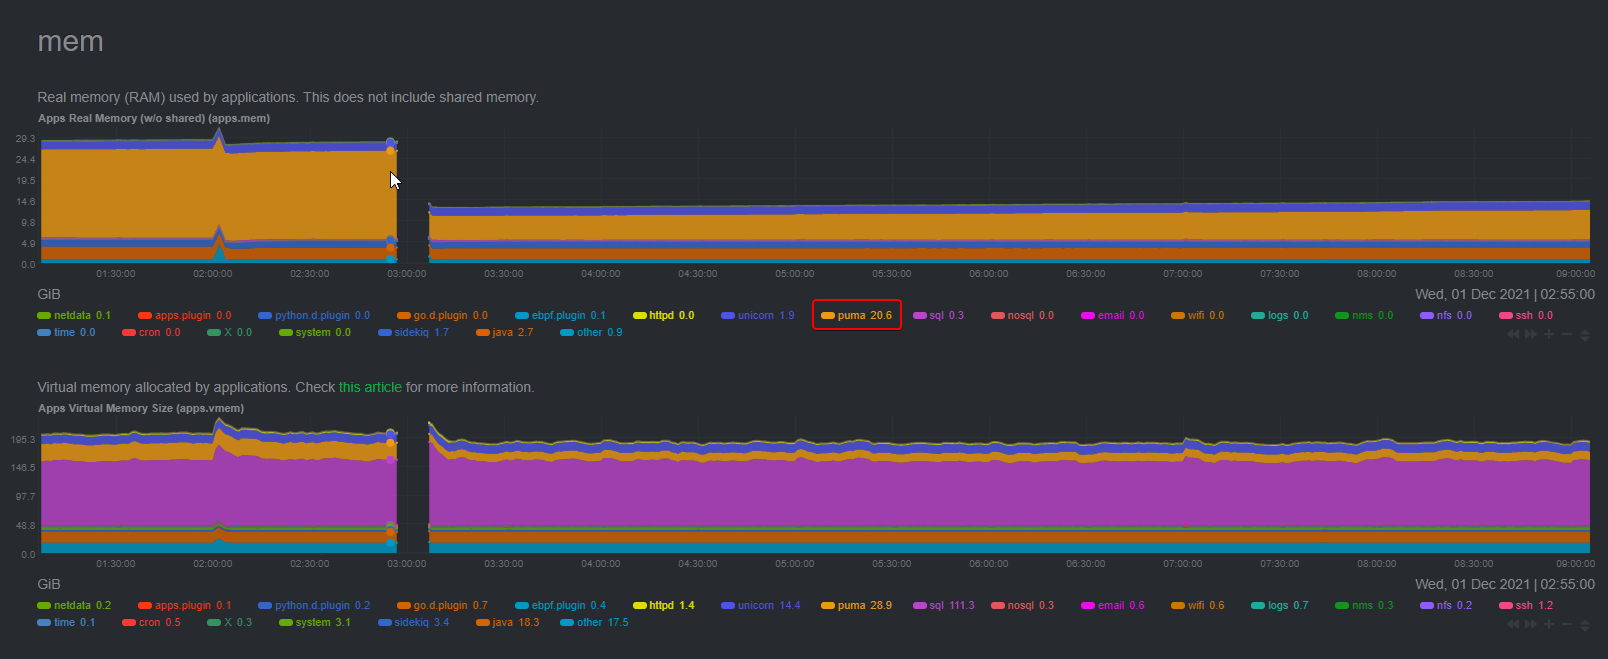
So, this may be of interest…after running foreman-installer --foreman-proxy-content-enable-katello-agent=false the apparent memory leak in the puma process appears to have stopped.
Services have been running for a week, and look like this: