Problem: Expected outcome: Foreman and Proxy versions: Foreman and Proxy plugin versions:
Distribution and version: Other relevant data:
sajha
July 29, 2022, 5:51pm
2
@John_Beranek : Is this something new you’re seeing with 4.5? @dralley : Is this something that has been noticed before?
No, I’d say it’s been around for quite some time. We end up having to restart all services now and then, to free up memory/swap.
“gunicorn”, or “unicorn”? Because the label says “unicorn” which seems to be a web server for Ruby. Unicorn (web server) - Wikipedia . “gunicorn” was named after it.
If the label is wrong and it’s actually measuring “gunicorn” memory consumption, then we’ve seen some issues but it was never clear if they were actual leaks or just transient memory spikes while Katello was indexing / querying / paging through the list of all the packages in Pulp. Package metadata can be quite large and so likewise those queries are dumping a lot of data.
https://github.com/pulp/pulpcore/issues/2250
So, questions to answer:
As mentioned, verify that it’s “gunicorn” (and if this grafana dashboard is something we distribute, fix that to be more correct)
(and if it is gunicorn)
So:
It’s definitely gunicorn, it’s just the ‘netdata’ monitoring agent which is mis-categorising gunicorn processes as ‘unicorn’. Just managed to find a listing from top in my tmux history from before I restarted services:
top - 08:10:14 up 20 days, 22:05,  1 user,  load average: 0.47, 0.36, 0.29
Tasks: 478 total,   2 running, 476 sleeping,   0 stopped,   0 zombie
%Cpu(s):  4.7 us,  7.9 sy,  0.3 ni, 86.1 id,  0.0 wa,  0.7 hi,  0.3 si,  0.0 st
MiB Mem :  33699.1 total,   3527.9 free,  21001.1 used,   9170.0 buff/cache
MiB Swap:   4096.0 total,    420.7 free,   3675.3 used.  11526.7 avail Mem

    PID USER      PR  NI    VIRT    RES    SHR S  %CPU  %MEM     TIME+ COMMAND
3676656 pulp      20   0 3624900   2.1g  17124 S   0.0   6.3   7:13.34 gunicorn
3676676 pulp      20   0 2749324   1.9g  17088 S   0.0   5.8   7:06.24 gunicorn
3675446 tomcat    20   0   10.1g   1.7g  14736 S   1.0   5.2 858:09.49 java
3676680 pulp      20   0 2159528   1.5g  17116 S   0.0   4.6   6:23.28 gunicorn
3668419 puppet    20   0 8549148   1.4g  13192 S   0.3   4.1  61:33.35 java
3669161 foreman   20   0 1521960   1.0g  10864 S   0.0   3.2  65:57.39 sidekiq
3676663 pulp      20   0 2386640 703784  17128 S   0.0   2.0   6:55.16 gunicorn
3676681 pulp      20   0 1149660 574204  17116 S   0.0   1.7   6:46.84 gunicorn
3676688 postgres  20   0  934192 569676 567504 S   0.0   1.7   3:29.45 postmaster
3676701 postgres  20   0  934192 569548 567384 S   0.0   1.7   3:37.32 postmaster
3676741 postgres  20   0  934192 569548 567412 S   0.3   1.7   3:40.15 postmaster
3676539 postgres  20   0  934192 569508 567372 S   0.0   1.7   3:36.82 postmaster
3676684 postgres  20   0  934192 569460 567324 S   0.0   1.7   3:30.69 postmaster
3676561 postgres  20   0  934192 569456 567320 S   0.0   1.7   3:39.82 postmaster
3676580 postgres  20   0  934192 569452 567316 S   0.0   1.7   3:34.86 postmaster
3676625 postgres  20   0  934192 569428 567292 S   0.0   1.7   3:36.43 postmaster
3668251 postgres  20   0  933160 559564 557792 S   0.0   1.6   4:57.31 postmaster
3668252 postgres  20   0  932276 555124 554252 S   0.0   1.6   1:31.60 postmaster
I’d not say the load on the Pulp service is especially high.
I’ll take a look at your 2 possible mitigations.
Well, I’ve not left it very long yet, but gunicorn memory usage hasn’t gone really high, but it also looks like no workers have recycled either:
$ ps auxww|grep unicorn
pulp      168063  0.0  0.0 316664 25600 ?        Ss   Jul29   0:34 /usr/bin/python3.9 /usr/bin/gunicorn pulpcore.app.wsgi:application --timeout 90 -w 5 --access-logfile - --access-logformat pulp [%({correlation-id}o)s]: %(h)s %(l)s %(u)s %(t)s "%(r)s" %(s)s %(b)s "%(f)s" "%(a)s"
pulp      168089  0.0  1.3 1014204 454992 ?      S    Jul29   0:57 /usr/bin/python3.9 /usr/bin/gunicorn pulpcore.app.wsgi:application --timeout 90 -w 5 --access-logfile - --access-logformat pulp [%({correlation-id}o)s]: %(h)s %(l)s %(u)s %(t)s "%(r)s" %(s)s %(b)s "%(f)s" "%(a)s"
pulp      168105  0.0  0.9 876528 317264 ?       S    Jul29   0:52 /usr/bin/python3.9 /usr/bin/gunicorn pulpcore.app.wsgi:application --timeout 90 -w 5 --access-logfile - --access-logformat pulp [%({correlation-id}o)s]: %(h)s %(l)s %(u)s %(t)s "%(r)s" %(s)s %(b)s "%(f)s" "%(a)s"
pulp      168106  0.0  1.0 934244 374928 ?       S    Jul29   1:13 /usr/bin/python3.9 /usr/bin/gunicorn pulpcore.app.wsgi:application --timeout 90 -w 5 --access-logfile - --access-logformat pulp [%({correlation-id}o)s]: %(h)s %(l)s %(u)s %(t)s "%(r)s" %(s)s %(b)s "%(f)s" "%(a)s"
pulp      168107  0.0  1.1 963332 399364 ?       S    Jul29   1:24 /usr/bin/python3.9 /usr/bin/gunicorn pulpcore.app.wsgi:application --timeout 90 -w 5 --access-logfile - --access-logformat pulp [%({correlation-id}o)s]: %(h)s %(l)s %(u)s %(t)s "%(r)s" %(s)s %(b)s "%(f)s" "%(a)s"
pulp      168121  0.0  1.0 930076 370768 ?       S    Jul29   1:25 /usr/bin/python3.9 /usr/bin/gunicorn pulpcore.app.wsgi:application --timeout 90 -w 5 --access-logfile - --access-logformat pulp [%({correlation-id}o)s]: %(h)s %(l)s %(u)s %(t)s "%(r)s" %(s)s %(b)s "%(f)s" "%(a)s"
_johnba+ 3367996  0.0  0.0 221932  1100 pts/0    S+   14:12   0:00 grep --color=auto --exclude-dir=.bzr --exclude-dir=CVS --exclude-dir=.git --exclude-dir=.hg --exclude-dir=.svn unicorn
pulp     3820614  0.0  0.1 371476 34764 ?        Ss   Jul29   0:54 /usr/bin/python3.9 /usr/bin/gunicorn pulpcore.content:server --timeout 90 --worker-class aiohttp.GunicornWebWorker -w 17 --access-logfile -
pulp     3820632  0.1  0.4 1011180 145860 ?      Sl   Jul29   8:54 /usr/bin/python3.9 /usr/bin/gunicorn pulpcore.content:server --timeout 90 --worker-class aiohttp.GunicornWebWorker -w 17 --access-logfile -
pulp     3820659  0.1  0.4 1084396 145164 ?      Sl   Jul29   7:26 /usr/bin/python3.9 /usr/bin/gunicorn pulpcore.content:server --timeout 90 --worker-class aiohttp.GunicornWebWorker -w 17 --access-logfile -
pulp     3820667  0.0  0.4 930804 139216 ?       Sl   Jul29   4:16 /usr/bin/python3.9 /usr/bin/gunicorn pulpcore.content:server --timeout 90 --worker-class aiohttp.GunicornWebWorker -w 17 --access-logfile -
pulp     3820674  0.0  0.4 929888 138072 ?       Sl   Jul29   3:47 /usr/bin/python3.9 /usr/bin/gunicorn pulpcore.content:server --timeout 90 --worker-class aiohttp.GunicornWebWorker -w 17 --access-logfile -
pulp     3820683  0.0  0.4 1004000 138520 ?      Sl   Jul29   3:57 /usr/bin/python3.9 /usr/bin/gunicorn pulpcore.content:server --timeout 90 --worker-class aiohttp.GunicornWebWorker -w 17 --access-logfile -
pulp     3820684  0.0  0.4 933760 141772 ?       Sl   Jul29   4:29 /usr/bin/python3.9 /usr/bin/gunicorn pulpcore.content:server --timeout 90 --worker-class aiohttp.GunicornWebWorker -w 17 --access-logfile -
pulp     3820686  0.2  0.4 1084924 145820 ?      Sl   Jul29  11:43 /usr/bin/python3.9 /usr/bin/gunicorn pulpcore.content:server --timeout 90 --worker-class aiohttp.GunicornWebWorker -w 17 --access-logfile -
pulp     3820690  0.1  0.4 1008684 143288 ?      Sl   Jul29   5:13 /usr/bin/python3.9 /usr/bin/gunicorn pulpcore.content:server --timeout 90 --worker-class aiohttp.GunicornWebWorker -w 17 --access-logfile -
pulp     3820694  0.1  0.4 1010140 144320 ?      Sl   Jul29   6:28 /usr/bin/python3.9 /usr/bin/gunicorn pulpcore.content:server --timeout 90 --worker-class aiohttp.GunicornWebWorker -w 17 --access-logfile -
pulp     3820695  0.1  0.4 1007748 142352 ?      Sl   Jul29   4:45 /usr/bin/python3.9 /usr/bin/gunicorn pulpcore.content:server --timeout 90 --worker-class aiohttp.GunicornWebWorker -w 17 --access-logfile -
pulp     3820716  0.0  0.4 1004000 138336 ?      Sl   Jul29   3:49 /usr/bin/python3.9 /usr/bin/gunicorn pulpcore.content:server --timeout 90 --worker-class aiohttp.GunicornWebWorker -w 17 --access-logfile -
pulp     3820735  0.0  0.4 1003992 138248 ?      Sl   Jul29   3:47 /usr/bin/python3.9 /usr/bin/gunicorn pulpcore.content:server --timeout 90 --worker-class aiohttp.GunicornWebWorker -w 17 --access-logfile -
pulp     3820738  0.0  0.4 1004132 138772 ?      Sl   Jul29   4:05 /usr/bin/python3.9 /usr/bin/gunicorn pulpcore.content:server --timeout 90 --worker-class aiohttp.GunicornWebWorker -w 17 --access-logfile -
pulp     3820739  0.1  0.4 1009164 143676 ?      Sl   Jul29   5:39 /usr/bin/python3.9 /usr/bin/gunicorn pulpcore.content:server --timeout 90 --worker-class aiohttp.GunicornWebWorker -w 17 --access-logfile -
pulp     3820742  0.0  0.4 1003976 138356 ?      Sl   Jul29   3:53 /usr/bin/python3.9 /usr/bin/gunicorn pulpcore.content:server --timeout 90 --worker-class aiohttp.GunicornWebWorker -w 17 --access-logfile -
pulp     3820745  0.4  0.4 1085500 146252 ?      Sl   Jul29  21:44 /usr/bin/python3.9 /usr/bin/gunicorn pulpcore.content:server --timeout 90 --worker-class aiohttp.GunicornWebWorker -w 17 --access-logfile -
pulp     3820748  0.3  0.4 1085032 145952 ?      Sl   Jul29  14:39 /usr/bin/python3.9 /usr/bin/gunicorn pulpcore.content:server --timeout 90 --worker-class aiohttp.GunicornWebWorker -w 17 --access-logfile -
I followed the process recycling steps, by the way.
The config from the linked comment only recycles after 1000 requests so that’s not terribly unexpected. We’ll have to see how quickly the memory use accumulates.
@John_Beranek How did it go?
So, left for a while it’s still happening - and it’s the Pulp WSGI app, apparently:
$ ps auxww --sort -rss
USER         PID %CPU %MEM    VSZ   RSS TTY      STAT START   TIME COMMAND
pulp      666130  0.0  7.8 3275912 2715680 ?     S    Aug10   1:51 /usr/bin/python3.9 /usr/bin/gunicorn pulpcore.app.wsgi:application --timeout 90 -w 5 --access-logfile - --access-logformat pulp [%({correlation-id}o)s]: %(h)s %(l)s %(u)s %(t)s "%(r)s" %(s)s %(b)s "%(f)s" "%(a)s"
pulp      662349  0.0  6.1 2699452 2139368 ?     S    Aug10   1:16 /usr/bin/python3.9 /usr/bin/gunicorn pulpcore.app.wsgi:application --timeout 90 -w 5 --access-logfile - --access-logformat pulp [%({correlation-id}o)s]: %(h)s %(l)s %(u)s %(t)s "%(r)s" %(s)s %(b)s "%(f)s" "%(a)s"
tomcat   3820660  4.6  5.7 10620440 1975444 ?    Ssl  Jul29 879:05 /usr/lib/jvm/jre-11/bin/java -Xms1024m -Xmx4096m -Dcom.redhat.fips=false -Djava.security.auth.login.config=/usr/share/tomcat/conf/login.config -classpath /usr/share/tomcat/bin/bootstrap.jar:/usr/share/tomcat/bin/tomcat-juli.jar:/usr/share/java/ant.jar:/usr/share/java/ant-launcher.jar:/usr/lib/jvm/java/lib/tools.jar -Dcatalina.base=/usr/share/tomcat -Dcatalina.home=/usr/share/tomcat -Djava.endorsed.dirs= -Djava.io.tmpdir=/var/cache/tomcat/temp -Djava.util.logging.config.file=/usr/share/tomcat/conf/logging.properties -Djava.util.logging.manager=org.apache.juli.ClassLoaderLogManager org.apache.catalina.startup.Bootstrap start
puppet   3820786  0.3  4.5 8551200 1581344 ?     Sl   Jul29  58:53 /usr/bin/java -Xms2G -Xmx2G -Dcom.redhat.fips=false -Djruby.logger.class=com.puppetlabs.jruby_utils.jruby.Slf4jLogger -XX:ReservedCodeCacheSize=512m -XX:OnOutOfMemoryError=kill -9 %p -XX:ErrorFile=/var/log/puppetlabs/puppetserver/puppetserver_err_pid%p.log -cp /opt/puppetlabs/server/apps/puppetserver/puppet-server-release.jar:/opt/puppetlabs/puppet/lib/ruby/vendor_ruby/facter.jar:/opt/puppetlabs/server/data/puppetserver/jars/* clojure.main -m puppetlabs.trapperkeeper.main --config /etc/puppetlabs/puppetserver/conf.d --bootstrap-config /etc/puppetlabs/puppetserver/services.d/,/opt/puppetlabs/server/apps/puppetserver/config/services.d/ --restart-file /opt/puppetlabs/server/data/puppetserver/restartcounter
foreman  3821536  0.3  3.1 1564628 1085956 ?     Ssl  Jul29  67:10 sidekiq 5.2.10  [0 of 5 busy]
pulp      662099  0.0  3.0 1629800 1069740 ?     S    Aug10   0:59 /usr/bin/python3.9 /usr/bin/gunicorn pulpcore.app.wsgi:application --timeout 90 -w 5 --access-logfile - --access-logformat pulp [%({correlation-id}o)s]: %(h)s %(l)s %(u)s %(t)s "%(r)s" %(s)s %(b)s "%(f)s" "%(a)s"
pulp     1767801  0.0  2.3 1372216 812204 ?      S    01:00   0:31 /usr/bin/python3.9 /usr/bin/gunicorn pulpcore.app.wsgi:application --timeout 90 -w 5 --access-logfile - --access-logformat pulp [%({correlation-id}o)s]: %(h)s %(l)s %(u)s %(t)s "%(r)s" %(s)s %(b)s "%(f)s" "%(a)s"
Just noticed those Pulp processes only started yesterday, though…
top - 11:24:44 up 34 days,  1:19,  1 user,  load average: 0.35, 0.53, 0.44
Tasks: 459 total,   1 running, 458 sleeping,   0 stopped,   0 zombie
%Cpu(s):  3.0 us,  1.2 sy,  0.3 ni, 95.1 id,  0.2 wa,  0.1 hi,  0.1 si,  0.0 st
MiB Mem :  33699.1 total,   1229.0 free,  21522.4 used,  10947.7 buff/cache
MiB Swap:   4096.0 total,   2890.4 free,   1205.6 used.  10899.9 avail Mem
Does a sawtooth pattern show up in your monitoring (which would demonstrate that at lest the recycling works). What happens when you tweak the recycle after count to be lower?
I wonder if we can correlate the requests being handled with the memory consumption somehow, even with low detail.
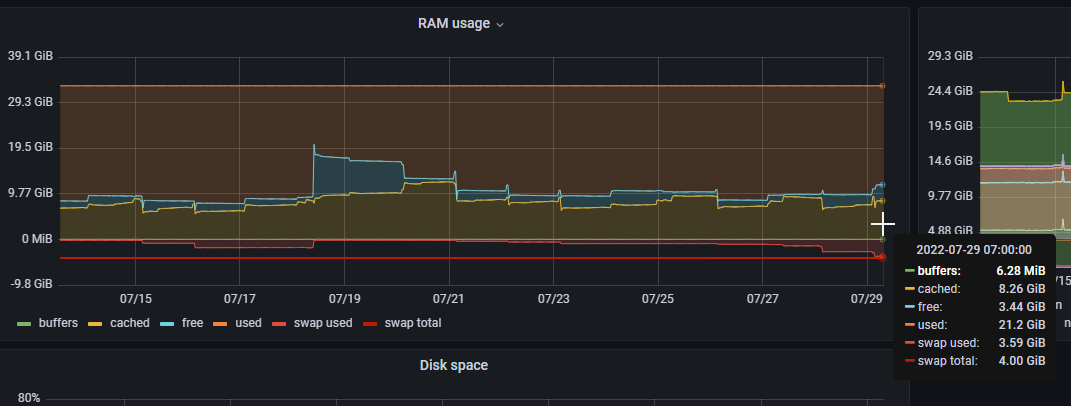
I’d say no sawtooth:
(I might teach the netdata agent the difference between different gunicorn processes, so it’ll show those as separate usage areas)
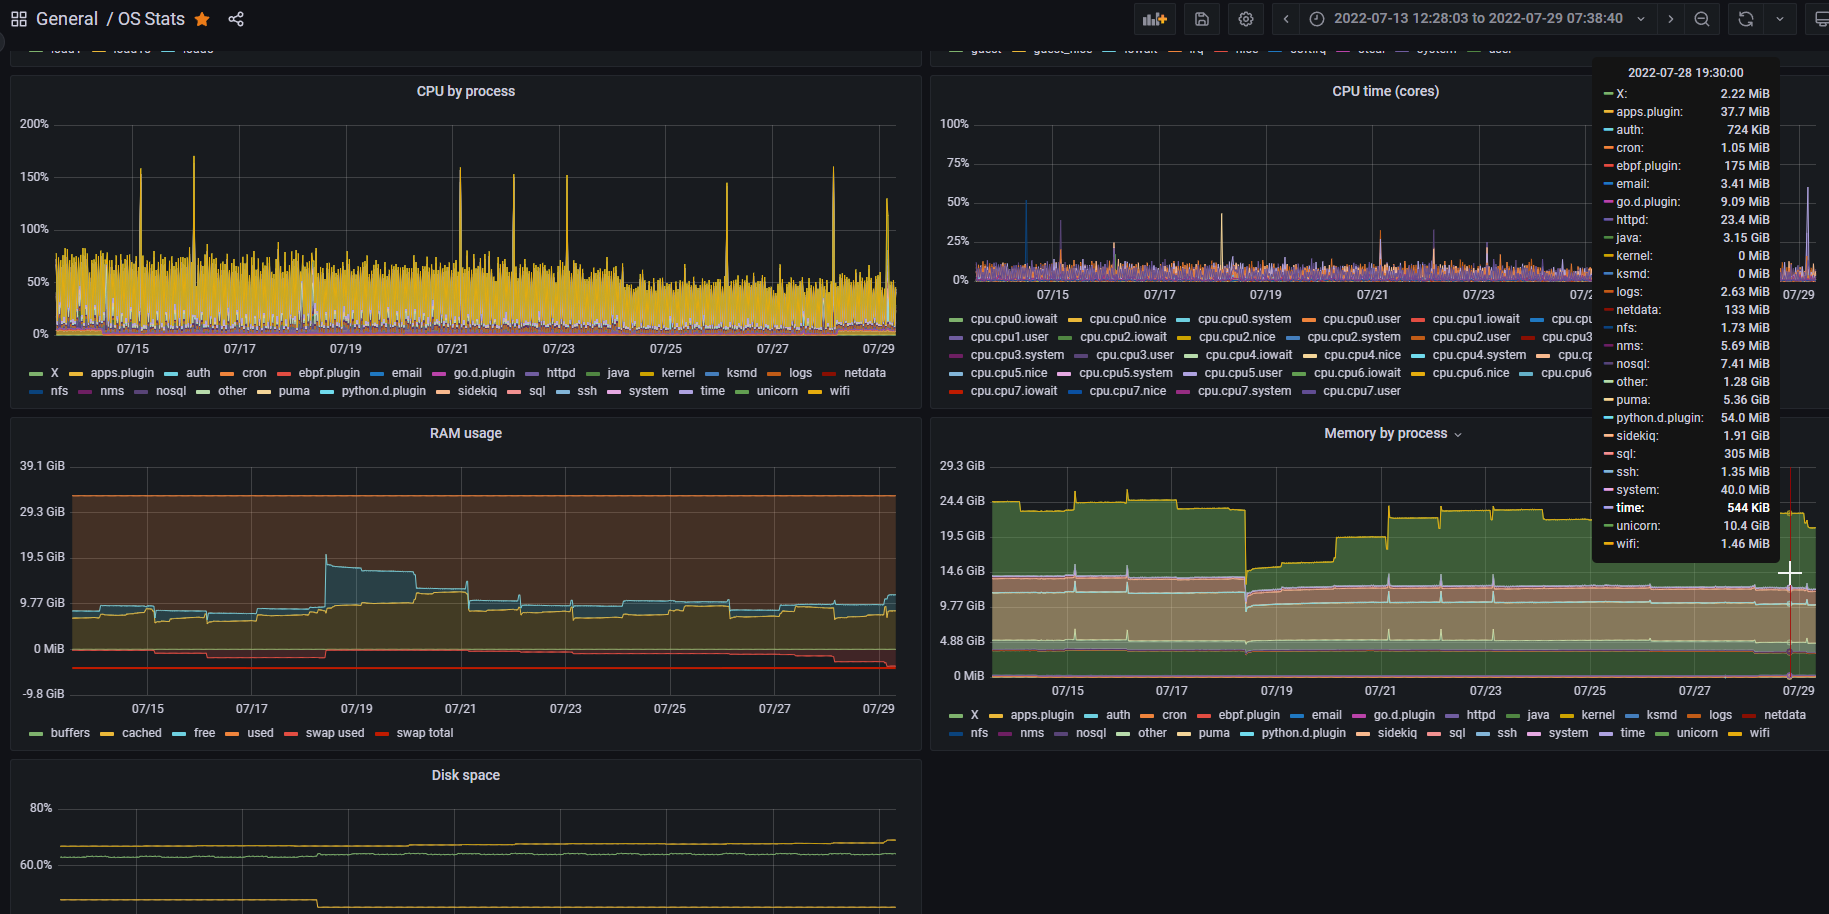
OK, I taught netdata about Foreman/Katello processes…
This is great, thanks. Hopefully broken out like this, any pattern will be more apparent
dralley
August 17, 2022, 10:10pm
16
@John_Beranek Is anything interesting showing up in the metrics?
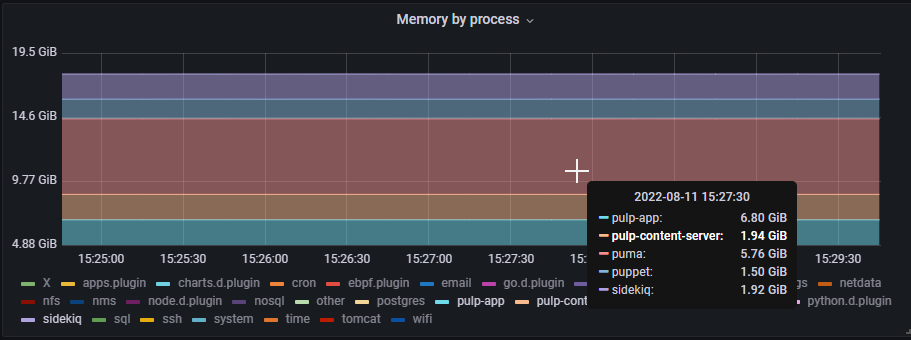
So, definitely something a bit peculiar…
dralley
August 19, 2022, 12:35am
18
Indeed. How many pulpcore API services do you have running? If it’s more than one then the process recycling could be triggering at different times which might explain at least part of this.
The points that stand out to me are:
Recovery is very staggered (little bits are recovered at a time, not all at once, which is not really what you expect from process recycling unless there’s multiple processes)
But then it spikes very quickly and stays there once triggered, so it’s not a gradual leak, it’s all at once.
Once we fix this, Puma will be using as much memory as everything else combined.
Can you check for tasks spawned around that time window where it spiked back up? It’s not guaranteed to be a problem with one of those request handlers but maybe we can narrow down whether it is or isn’t.
Pulp task workers are measured separately from the API server processes correct? I don’t see them explicitly labeled.
So, sorting my percentage memory use, I see no processes started on 17th August:
3820680 Fri Jul 29 08:10:46 2022 533580  1.5 sidekiq 5.2.10  [0 of 1 bus sidekiq 5.2.10  [0 of 1 busy]
3820622 Fri Jul 29 08:10:44 2022 553384  1.6 postgres: background writer postgres: background writer
3820621 Fri Jul 29 08:10:44 2022 558852  1.6 postgres: checkpointer     postgres: checkpointer
3820965 Fri Jul 29 08:11:08 2022 568972  1.6 postgres: pulp pulpcore 127 postgres: pulp pulpcore 127.0.0.1(42592) idle
3820967 Fri Jul 29 08:11:08 2022 569004  1.6 postgres: pulp pulpcore 127 postgres: pulp pulpcore 127.0.0.1(42596) idle
3820966 Fri Jul 29 08:11:08 2022 569076  1.6 postgres: pulp pulpcore 127 postgres: pulp pulpcore 127.0.0.1(42594) idle
3820970 Fri Jul 29 08:11:08 2022 569084  1.6 postgres: pulp pulpcore 127 postgres: pulp pulpcore 127.0.0.1(42602) idle
3820973 Fri Jul 29 08:11:08 2022 569084  1.6 postgres: pulp pulpcore 127 postgres: pulp pulpcore 127.0.0.1(42606) idle
3820971 Fri Jul 29 08:11:08 2022 569140  1.6 postgres: pulp pulpcore 127 postgres: pulp pulpcore 127.0.0.1(42604) idle
3820968 Fri Jul 29 08:11:08 2022 569160  1.6 postgres: pulp pulpcore 127 postgres: pulp pulpcore 127.0.0.1(42598) idle
3820969 Fri Jul 29 08:11:08 2022 569228  1.6 postgres: pulp pulpcore 127 postgres: pulp pulpcore 127.0.0.1(42600) idle
3821536 Fri Jul 29 08:11:26 2022 1103280  3.1 sidekiq 5.2.10  [0 of 5 bus sidekiq 5.2.10  [0 of 5 busy]
3820786 Fri Jul 29 08:10:48 2022 1537956  4.4 /usr/bin/java -Xms2G -Xmx2G /usr/bin/java -Xms2G -Xmx2G -Dcom.redhat.fips=false -Djruby.logger.class=com.puppetlabs.jruby_utils.jruby.Slf4jLogger -XX:ReservedCodeCacheSize=512m -XX:OnOutOfMemoryError=kill -9 %p -XX:ErrorFile=
2275156 Mon Aug 15 02:00:36 2022 1678620  4.8 /usr/bin/python3.9 /usr/bin /usr/bin/python3.9 /usr/bin/gunicorn pulpcore.app.wsgi:application --timeout 90 -w 5 --access-logfile - --access-logformat pulp [%({correlation-id}o)s]: %(h)s %(l)s %(u)s %(t)s "%(r)s" %(s)s %(b)s
3820660 Fri Jul 29 08:10:46 2022 1877284  5.4 /usr/lib/jvm/jre-11/bin/jav /usr/lib/jvm/jre-11/bin/java -Xms1024m -Xmx4096m -Dcom.redhat.fips=false -Djava.security.auth.login.config=/usr/share/tomcat/conf/login.config -classpath /usr/share/tomcat/bin/bootstrap.jar:/usr/sh
2449411 Mon Aug 15 05:30:42 2022 1997128  5.7 /usr/bin/python3.9 /usr/bin /usr/bin/python3.9 /usr/bin/gunicorn pulpcore.app.wsgi:application --timeout 90 -w 5 --access-logfile - --access-logformat pulp [%({correlation-id}o)s]: %(h)s %(l)s %(u)s %(t)s "%(r)s" %(s)s %(b)s
2422326 Mon Aug 15 05:00:38 2022 2220392  6.4 /usr/bin/python3.9 /usr/bin /usr/bin/python3.9 /usr/bin/gunicorn pulpcore.app.wsgi:application --timeout 90 -w 5 --access-logfile - --access-logformat pulp [%({correlation-id}o)s]: %(h)s %(l)s %(u)s %(t)s "%(r)s" %(s)s %(b)s
I’m not detecting the “/usr/bin/pulpcore-worker” processes (I guess that’s what you mean) separately currently, so I think they’re under the “other” in the chart.
By “pulpcore API” services do you mean the processes like:
/usr/bin/python3.9 /usr/bin /usr/bin/python3.9 /usr/bin/gunicorn pulpcore.app.wsgi:application
If so, we have 6 - with one of those being the parent of the 5 others.