Katello nightly pipeline failed:
https://ci.theforeman.org/job/katello-nightly-rpm-pipeline/1633/
foreman-pipeline-katello-rpm-nightly (failed) (remote job)

Katello nightly pipeline failed:
https://ci.theforeman.org/job/katello-nightly-rpm-pipeline/1633/
foreman-pipeline-katello-rpm-nightly (failed) (remote job)
This looks similar to the failure we had the other day, but on a different page.
  Full diff:
    [
  -  ,
  +  'https://192.168.122.140/katello/api/v2/repository_sets?organization_id=1&with_active_subscription=true&search=(((name+!~+source+rpm)+and+(name+!~+debug+rpm)+and+(content_type+%3D+yum)+and+(label+!~+beta)+and+(label+!~+htb)+and+(name+!~+beta)+and+(product_name+!~+beta))) '
  +  '- Failed to load resource: the server responded with a status of 500 ()',
    ]
Again, we see the same fatal error in the logs:
2023-03-30T23:30:33 [F|app|c2fb68a2]
 c2fb68a2 | TypeError (nil can't be coerced into Integer):
 c2fb68a2 |
 c2fb68a2 | lib/foreman/middleware/logging_context_session.rb:22:in `call'
 c2fb68a2 | lib/foreman/middleware/logging_context_request.rb:11:in `call'
 c2fb68a2 | katello (4.9.0.pre.master) lib/katello/prevent_json_parsing.rb:12:in `call'
I think we should check what the array of middleware is so what it’s actually calling, because the stack trace is incomplete.
In the foreman_ssl_access_ssl.log there is this message:
192.168.122.142 - - [30/Mar/2023:23:30:32 +0000] "GET /katello/api/v2/repository_sets?organization_id=1&with_active_subscription=true&search=(((name+!~+source+rpm)+and+(name+!~+debug+rpm)+and+(content_type+%3D+yum)+and+(label+!~+beta)+and+(label+!~+htb)+and+(name+!~+beta)+and+(product_name+!~+beta))) HTTP/2.0" 500 46 "https://192.168.122.140/redhat_repositories" "Mozilla/5.0 (X11; Linux x86_64) AppleWebKit/537.36 (KHTML, like Gecko) HeadlessChrome/111.0.5563.64 Safari/537.36"
but in the production log it only shows as:
2023-03-30T23:30:32 [I|app|c2fb68a2] Started GET "/katello/api/v2/repository_sets?organization_id=1&with_active_subscription=true&search=(((name+!~+source+rpm)+and+(name+!~+debug+rpm)+and+(content_type+%3D+yum)+and+(label+!~+beta)+and+(label+!~+htb)+and+(name+!~+beta)+and+(product_name+!~+beta)))" for 192.168.122.142 at 2023-03-30 23:30:32 +0000
And doesn’t seem to have any sort of trace back. So is this an Apache error since it doesn’t seem like the server is actually 500ing?
No, I think Apache is just fine. We can see there’s some fatal error happening in the middleware. Rails on Rack — Ruby on Rails Guides says we can use bin/rails middleware to show the middleware in use, so that would be useful to know.
In case people are unfamiliar with middleware, it may help to provide some background. Granted, this is for Django:
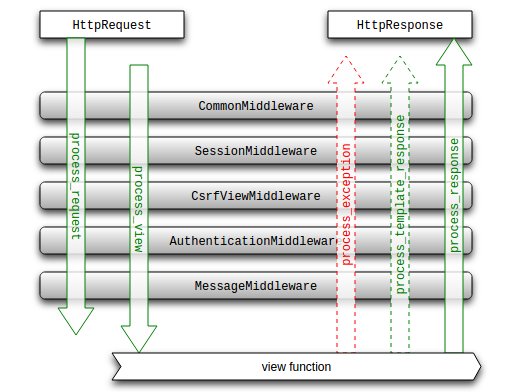
But Rails middleware is roughly the same:
The error handler is also implemented as middleware, so if middleware crashes before the error handler is invoked, you don’t get any error page and no proper logging either, which is what we’re seeing.
This is why it’s useful to know what the middleware stack actually is.
[root@pipe-katello-server-nightly-almalinux8 vagrant]# foreman-rake middleware
use SecureHeaders::Middleware
use ActionDispatch::HostAuthorization
use ActionDispatch::SSL
use Rack::Sendfile
use ActionDispatch::Executor
use ActiveSupport::Cache::Strategy::LocalCache::Middleware
use Rack::Runtime
use Rack::MethodOverride
use ActionDispatch::RequestId
use ActionDispatch::RemoteIp
use Foreman::Middleware::LoggingContextRequest
use Sprockets::Rails::QuietAssets
use Rails::Rack::Logger
use ActionDispatch::ShowExceptions
use ActionDispatch::DebugExceptions
use ActionDispatch::ActionableExceptions
use ActionDispatch::Callbacks
use ActionDispatch::Cookies
use ActionDispatch::Session::ActiveRecordStore
use Foreman::Middleware::LoggingContextSession
use ActionDispatch::Flash
use ActionDispatch::ContentSecurityPolicy::Middleware
use ActionDispatch::PermissionsPolicy::Middleware
use Rack::Head
use Rack::ConditionalGet
use Rack::ETag
use Rack::TempfileReaper
use Apipie::Middleware::ChecksumInHeaders
use Foreman::Middleware::Telemetry
use Foreman::Middleware::LibvirtConnectionCleaner
use ActionDispatch::Static
use Apipie::Extractor::Recorder::Middleware
use Apipie::StaticDispatcher
use ApipieDSL::StaticDispatcher
run Foreman::Application.routes
I got this from running the same install scenario in nightly, and ran this on the server box.
So from what you were saying before @ekohl it failed before Rails::Rack::Logger or do I have it backwards?
Thank you for that information. This is an area I don’t have a lot of experience with. We do see lib/foreman/middleware/logging_context_session.rb which corresponds to Foreman::Middleware::LoggingContextSession, which is actually much further down than Logger. Not to be confused with LoggingContextRequest.
I’ll need to study the actual code a bit more to understand what’s happening.
Just making a note here: we can consistently see this failing over the past few days.
Looking at Katello’s and Foreman’s git log I don’t see anything that would even touch these areas, so I wonder if this is something in some other RPM we updated that now interacts unexpectedly. We don’t see this in Foreman’s tests so I don’t know if it’s just chance.
Katello does have additional middleware that Foreman doesn’t, so either Katello::Middleware::EventDaemon (which I still question; you shouldn’t attempt to start a daemon thread in middleware) or Katello::Middleware::OrganizationCreatedEnforcer are suspects to me.
For example, it could be this line:
If the file was somehow corrupted or there’s a race condition, it could be empty and return nil perhaps?
Not entirely the same situation and very old, but it looks like it could happen:
Reading more on Rails, you are supposed to wrap threads that you spawn:
So perhaps this is something that would make the EventDaemon safer.
I’ve opened a PR with some potential fixes:
This topic was automatically closed 7 days after the last reply. New replies are no longer allowed.