We are a extremely heavy user of Foreman and Dynflow. I would guess maybe even the largest in the world. 70,000 hosts, around 2M facts processed daily, and around 150,000-300,000 daily jobs.
The new job invocations page is quite a bit (to put it nicely) slower in loading than the previous old page.
In addition, it doesn’t appear to update live like the old one did. I see hosts that show Pending, but if you click on the arrow to see the output, they have already finished their job.
When loading the Legacy page (32,000 job test) it loads in about 3-6 seconds, that includes all the hosts and their statuses. And it updates live, and quickly.
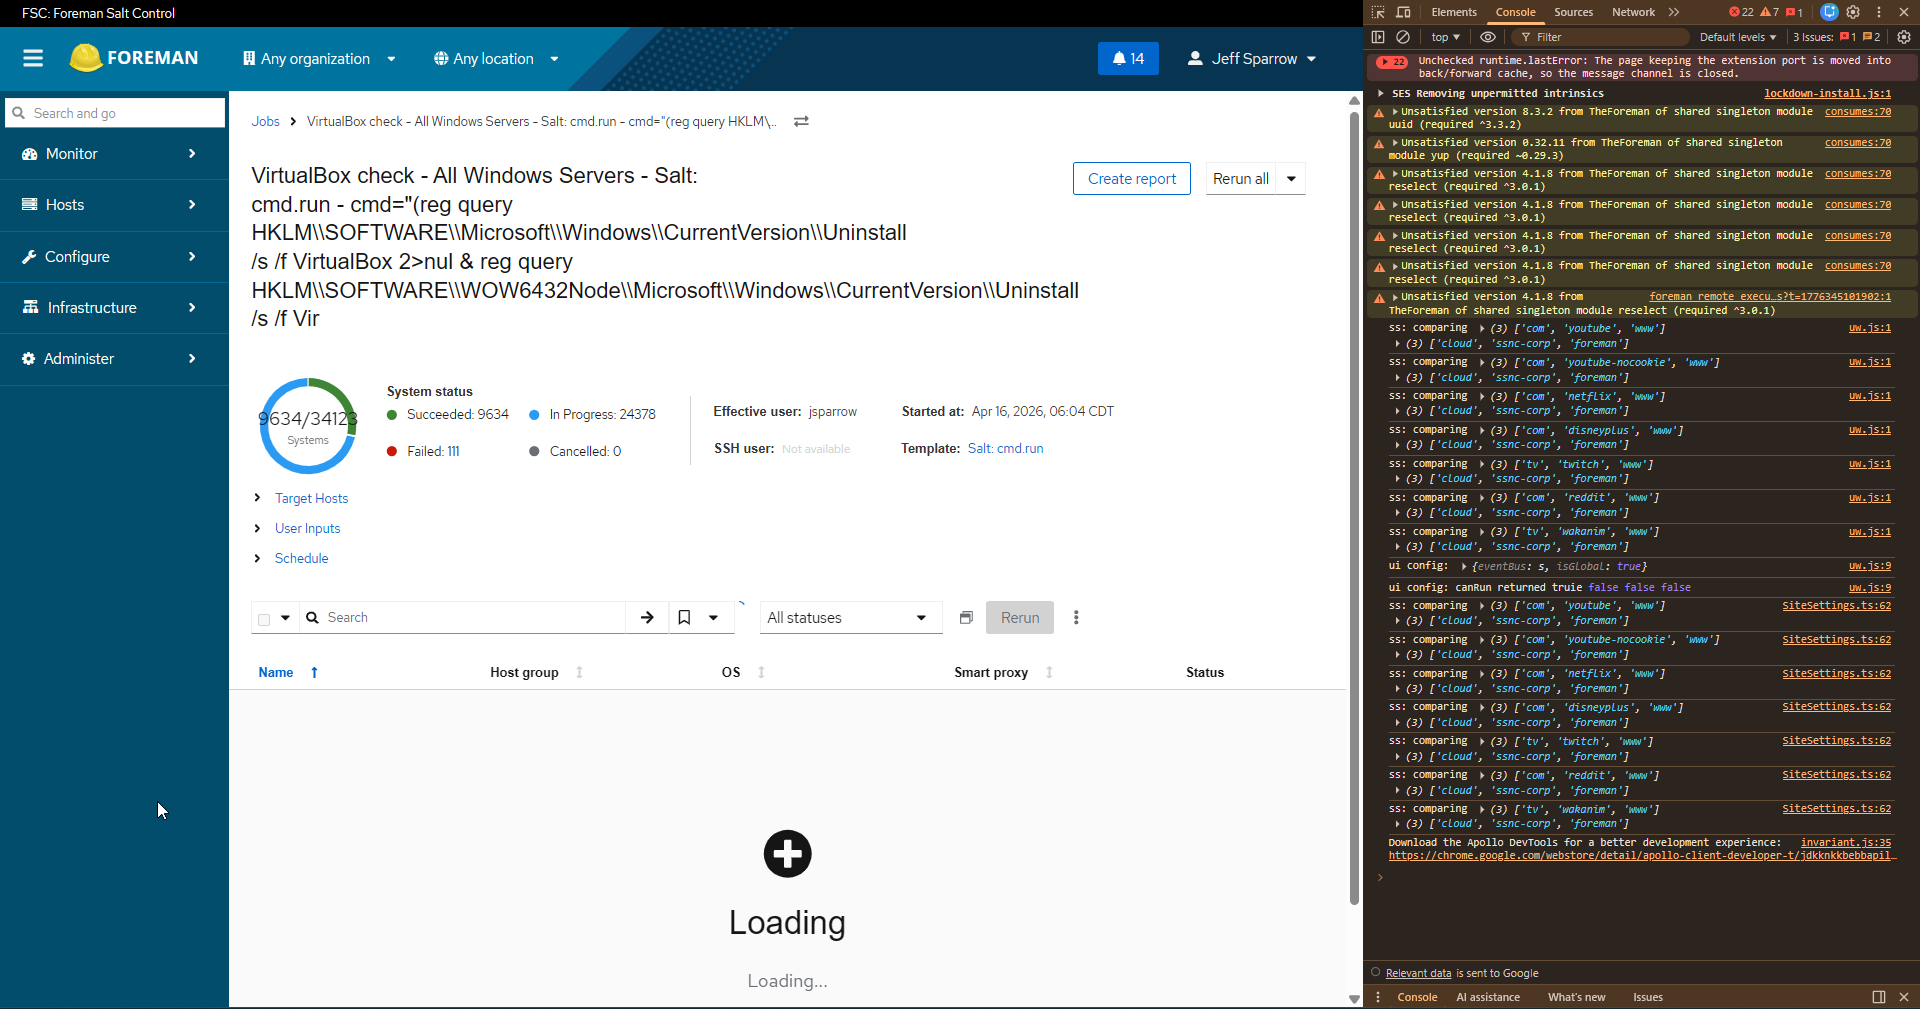
The new UI isn’t even useable. If I load the new UI on the same parent job (32,000 jobs), it loads and loads and loads and never seems to complete. Each load I have waited about 12-17 mins. After 2-3 mins it loads the job page itself. After another 10-15 mins the host lists still shows loading. It took me around 20 mins to write this post, the hosts are still stuck loading.
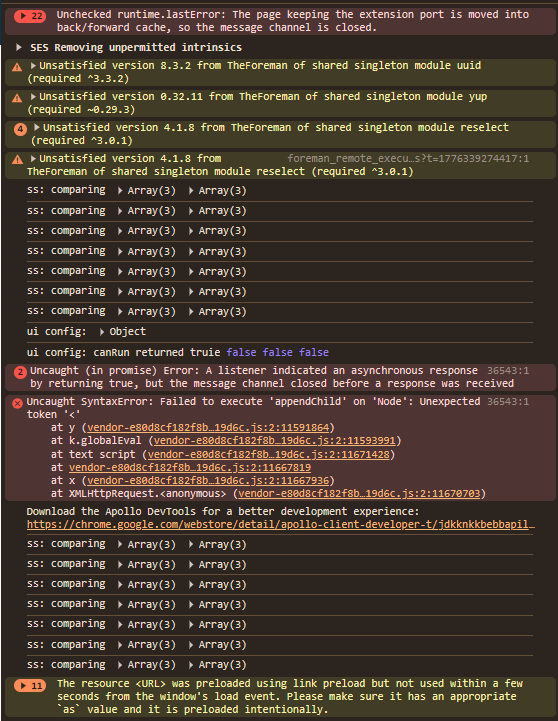
On occasion, we also see this error:
TypeError: Cannot read properties of undefined (reading 'length') in g in t in main in div in Page in div in FlexItem in div in Flex in p in b in t in o in a in Connect(a) in vo in div in h in IntlProvider in I18nProviderWrapper(h) in d in StoreProvider(I18nProviderWrapper(h)) in DataProvider(StoreProvider(I18nProviderWrapper(h))) in Unknown
Expected outcome:
The new jobs page loads as quickly (if not quicker) than the current Legacy page.
took about 6 mins this time just to load the page, but the hosts section below will never load (at least not for the 20 mins Ive attempted to wait 3-4 times)
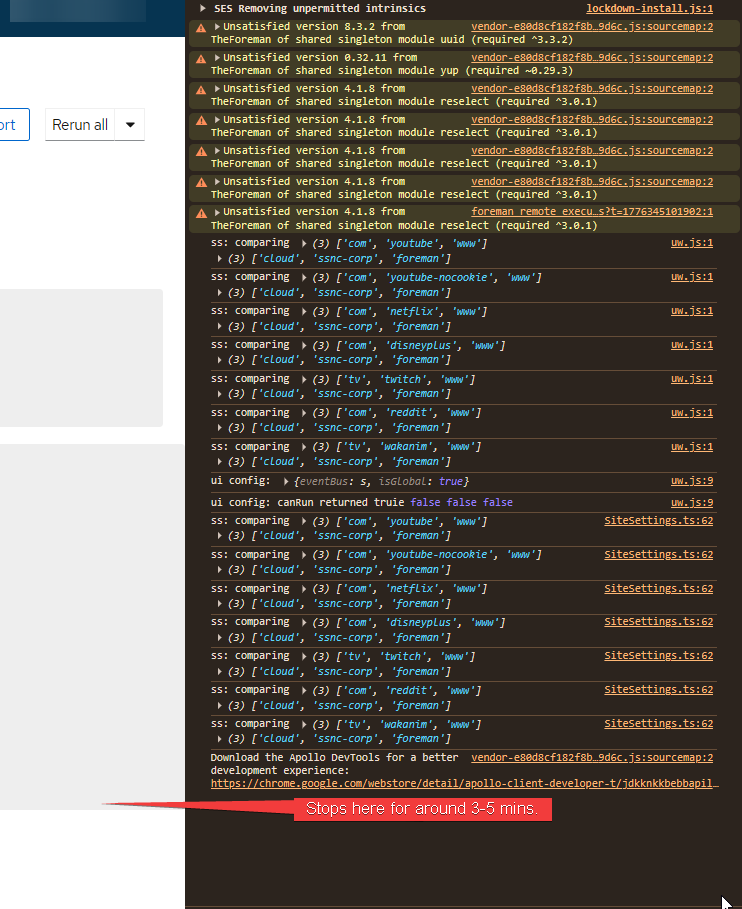
@aruzicka@MariaAga any ideas here? I don’t recognize any of those console errors.. And while I’m sure we didn’t test with 34k hosts, it should only be dealing with 25 at a time.
Incidentally, as I was working on this - we had a massive issue with the database (seemingly on the hosts table) and had to actually restart the database.
Foreman DB Slowness — Summary
Database: 56 GB PostgreSQL 17 on foreman-salt-control-pg17-admin.redacted
Root Causes
hosts table seq scans — 6.3M full table scans despite having 13 indexes. The planner isn’t using them, likely due to queries filtering on unindexed column combinations. This is the most probable cause of slowness.
Data bloat — Several tables have never been purged:
logs: 16 GB / 117M rows
audits: 12 GB / 28.7M rows
taxable_taxonomies: 9.7 GB / 57.9M rows
reports: 6.3 GB (5.8 GB is TOAST/report body content)
sessions: 1.5 GB / 3.9M stale sessions
229 idle connections from Foreman holding persistent PG backends open.
What’s Healthy
Cache hit ratio is 99.89% (good)
Autovacuum is running, dead tuple counts are low
No lock contention or long-running queries at time of check
CREATE INDEX CONCURRENTLY index_hosts_on_lower_name_and_type ON hosts (type, lower(name));
Why: Foreman queries the hosts table using WHERE type = $1 AND LOWER(name) = '...' on every host checkin/task. The existing index_hosts_on_name is on name (case-sensitive), but the application queries use LOWER(name), so PostgreSQL couldn’t use the index and performed a full table scan every time. With 70K hosts and 34K+ concurrent task jobs, this resulted in millions of sequential scans.
Result:
Before: 20ms average per query, 6.3M sequential scans on the hosts table
After: 0.096ms per query (200x improvement), planner now uses the new index
2,580 index scans recorded within minutes of creation
So everything does actually load faster now. Our All Hosts page, the host page itself. No change in the new jobs UI though. Same issue.
More information. The page seems to load somewhat normally immediately after kicking off a job. You still have to wait 4-6 mins, but it does eventually load and the hosts also load. However, if you attempt to refresh the page, or go from legacy back to new ui, that is where the hosts just never seem to load.
Hi Jeff. Can I ask you if you’re comparing between different releases or are you using the same release and changing “live” between legacy and “new”? If so, can you tell me how so I can reproduce it?
Thank you so much for replying. Not comparing between different releases, we are running all latest in our prod env (70,000 minions). Just switching between Legacy and New.
I will try to get some more data points for you. I will try running:
100 host job
1000 host job
10,000 host job
We can see if they exponentially get longer to load.
100 hosts = 1-2 second load times for both the page, and the hosts list.
1000 hosts = 2-4 seconds load times for the page, 1-2 second load time for the hosts list.
30,000 hosts = fail
I’ll try to run 10,000 - It does seem there might be some threshold it hits and then fails.
I tried to look up where that query exactly happens to see where that happens but I couldn’t find it. I had hoped to find out if this was a regression in the Ruby code. Anyone has more luck than I did?
Now I also wonder if this is a pattern we have in other places: query on a field that has an index, but is lowered at runtime. Worse, it may also fail some validations if we rely on database-level unique indexes.
One thing I can tell you is that when the jobs page get stuck loading, anything related to Hosts gets backed up and slow. You cannot even load the All Hosts page (set to 25) if youre waiting for the job page to load.
Wanted to follow up on this and see if there was ever a bug/issue created for this, and if there are any fixes for it? We run in to this daily. Best thing we can do for now is force the source code to load the legacy page, since its the only one that works.