Problem:
search requests consume large amount of memory and is reproducable
Expected outcome:
use less memory?
Foreman and Proxy versions:
3.4.1 foreman
4.6 katello
Distribution and version:
rhel8
Other relevant data:
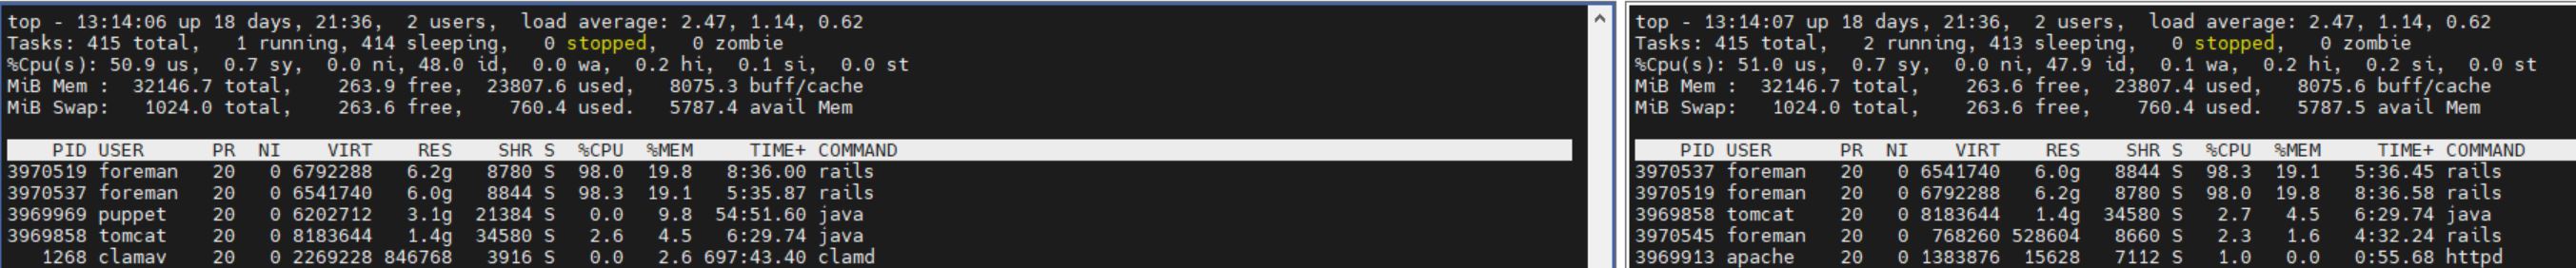
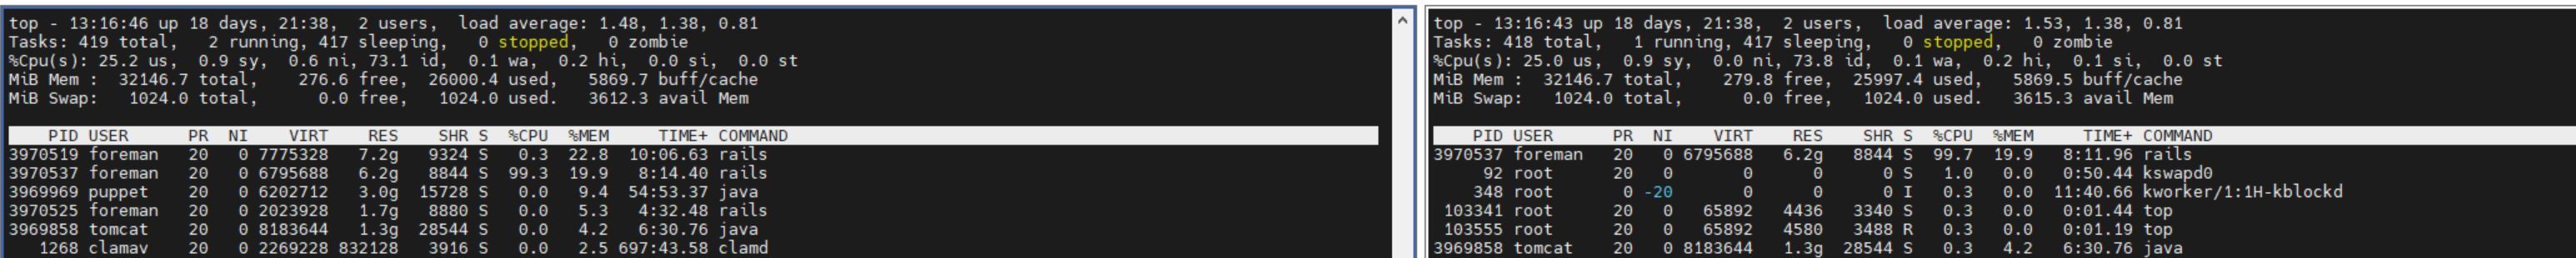
when using the search bar in the “All Hosts” Page and start for instance a simple search request, like installed_package_name = htop a rails job is invoked which gradually increases up to ~9gb at 100% cpu load So in case multiple search request gets started oom-killer is invoked. I had this case several times already and was wondering why this search request needs so much memory. Its always observed after any search request. Has someone observed this in a prod environment? On my test-instance the search request is quickly termintated and works as expected but only two test-clients are served by test-instance so not really comparable to prod…
Foreman-prod setup serves ~200 Hosts
root@foreman [foreman-prod] /var/log # strace -f -p 82211
strace: Process 82211 attached with 18 threads
[pid 82318] [ Process PID=82318 runs in x32 mode. ]
[pid 497921] futex(0x7ff2393d3fa4, FUTEX_WAIT_PRIVATE, 0, NULL <unfinished ...>
[pid 367682] futex(0x55b81142f3c0, FUTEX_WAIT_PRIVATE, 0, NULL <unfinished ...>
[pid 82339] futex(0x55b811b436c4, FUTEX_WAIT_PRIVATE, 0, NULL <unfinished ...>
[pid 82338] futex(0x55b811b43000, FUTEX_WAIT_PRIVATE, 0, NULL <unfinished ...>
[pid 82337] futex(0x55b811b427a0, FUTEX_WAIT_PRIVATE, 0, NULL <unfinished ...>
[pid 82336] restart_syscall(<... resuming interrupted futex ...> <unfinished ...>
[pid 82335] futex(0x55b811b41c10, FUTEX_WAIT_PRIVATE, 0, NULL <unfinished ...>
[pid 82329] futex(0x55b811ba5aa4, FUTEX_WAIT_PRIVATE, 0, NULL <unfinished ...>
[pid 82306] futex(0x55b811ba0ae0, FUTEX_WAIT_PRIVATE, 0, NULL <unfinished ...>
[pid 82296] futex(0x55b8110c2724, FUTEX_WAIT_PRIVATE, 0, NULL <unfinished ...>
[pid 82281] futex(0x55b811b91574, FUTEX_WAIT_PRIVATE, 0, NULL <unfinished ...>
[pid 82280] futex(0x7ff23801ecc0, FUTEX_WAIT_PRIVATE, 0, NULL <unfinished ...>
[pid 82231] futex(0x55b80f78f324, FUTEX_WAIT_PRIVATE, 0, NULL <unfinished ...>
[pid 82213] ppoll([{fd=12, events=POLLIN}], 1, NULL, NULL, 8 <unfinished ...>
[pid 82211] ppoll([{fd=4, events=POLLIN}], 1, NULL, NULL, 8 <unfinished ...>
[pid 82295] futex(0x55b80cc87f40, FUTEX_WAIT_PRIVATE, 0, NULL <unfinished ...>
[pid 82279] ppoll([{fd=10, events=POLLIN}], 1, NULL, NULL, 8 <unfinished ...>
[pid 82336] <... restart_syscall resumed>) = -1 ETIMEDOUT (Connection timed out)
[pid 82336] futex(0x55b7fd65d330, FUTEX_WAKE_PRIVATE, 1) = 0
[pid 82336] futex(0x55b811b420e0, FUTEX_WAIT_PRIVATE, 0, {tv_sec=0, tv_nsec=99976333}) = -1 ETIMEDOUT (Connection timed out)
[pid 82336] futex(0x55b7fd65d330, FUTEX_WAKE_PRIVATE, 1) = 0
[pid 82336] futex(0x55b811b420e0, FUTEX_WAIT_PRIVATE, 0, {tv_sec=0, tv_nsec=99976314}) = -1 ETIMEDOUT (Connection timed out)
[pid 82336] futex(0x55b7fd65d330, FUTEX_WAKE_PRIVATE, 1) = 0
[pid 82336] futex(0x55b811b420e0, FUTEX_WAIT_PRIVATE, 0, {tv_sec=0, tv_nsec=99971750}) = -1 ETIMEDOUT (Connection timed out)
[pid 82336] futex(0x55b7fd65d330, FUTEX_WAKE_PRIVATE, 1) = 0
[pid 82336] futex(0x55b811b420e0, FUTEX_WAIT_PRIVATE, 0, {tv_sec=0, tv_nsec=99971298} <unfinished ...>
[pid 82318] [ Process PID=82318 runs in 64 bit mode. ]
[pid 82318] mprotect(0x7ff0db0cc000, 32768, PROT_READ|PROT_WRITE) = 0
[pid 82318] mprotect(0x7ff0db0d4000, 4096, PROT_READ|PROT_WRITE) = 0
[pid 82318] mprotect(0x7ff0db0d5000, 32768, PROT_READ|PROT_WRITE) = 0
[pid 82318] mprotect(0x7ff0db0dd000, 4096, PROT_READ|PROT_WRITE) = 0
[pid 82318] mprotect(0x7ff0db0de000, 32768, PROT_READ|PROT_WRITE) = 0
[pid 82318] mprotect(0x7ff0db0e6000, 4096, PROT_READ|PROT_WRITE) = 0
[pid 82318] mprotect(0x7ff0db0e7000, 32768, PROT_READ|PROT_WRITE) = 0
[pid 82318] mprotect(0x7ff0db0ef000, 4096, PROT_READ|PROT_WRITE) = 0
[pid 82318] mprotect(0x7ff0db0f0000, 32768, PROT_READ|PROT_WRITE) = 0
[pid 82318] mprotect(0x7ff0db0f8000, 4096, PROT_READ|PROT_WRITE) = 0
[pid 82318] mprotect(0x7ff0db0f9000, 32768, PROT_READ|PROT_WRITE) = 0
[pid 82318] mprotect(0x7ff0db101000, 4096, PROT_READ|PROT_WRITE) = 0
[pid 82318] mprotect(0x7ff0db102000, 32768, PROT_READ|PROT_WRITE) = 0
[pid 82318] mprotect(0x7ff0db10a000, 4096, PROT_READ|PROT_WRITE) = 0
[pid 82318] mprotect(0x7ff0db10b000, 32768, PROT_READ|PROT_WRITE) = 0
[pid 82318] mprotect(0x7ff0db113000, 4096, PROT_READ|PROT_WRITE) = 0
[pid 82318] mprotect(0x7ff0db114000, 32768, PROT_READ|PROT_WRITE) = 0
[pid 82318] mprotect(0x7ff0db11c000, 4096, PROT_READ|PROT_WRITE) = 0