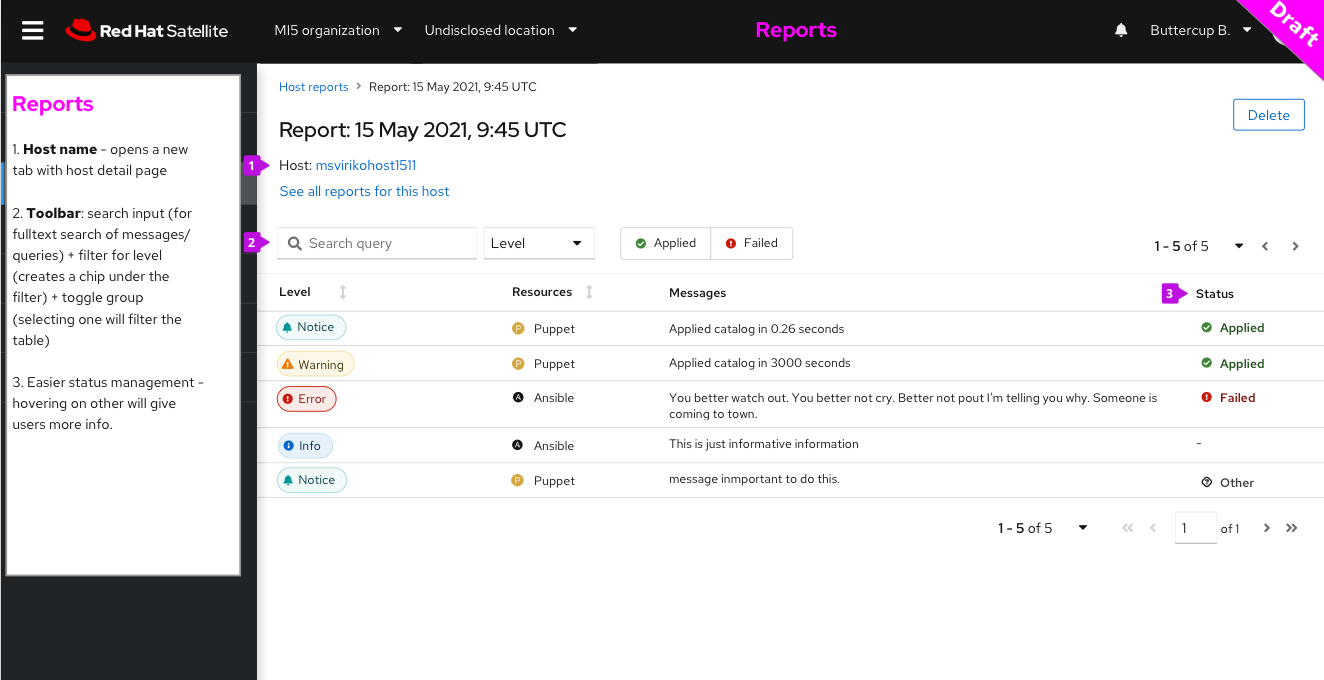
So what we did is that we removed charts (as we didn’t see much value there), added a status column, and the ability to filter statuses and search full-text. That’s all in PF4 new look.
What’s more, we simplify statuses to show just three eventful statuses: Applied/Failed/Other to be more consistent with other report types. (Hovering on ‘other’ status will give you more information about the status.) Do you miss any essential status here?
Why “See all reports for this host” is such a long text? I would expect this to be a button next to the Delete button in the top right corner? Perhaps with “Other reports” label, there is plenty of space there.
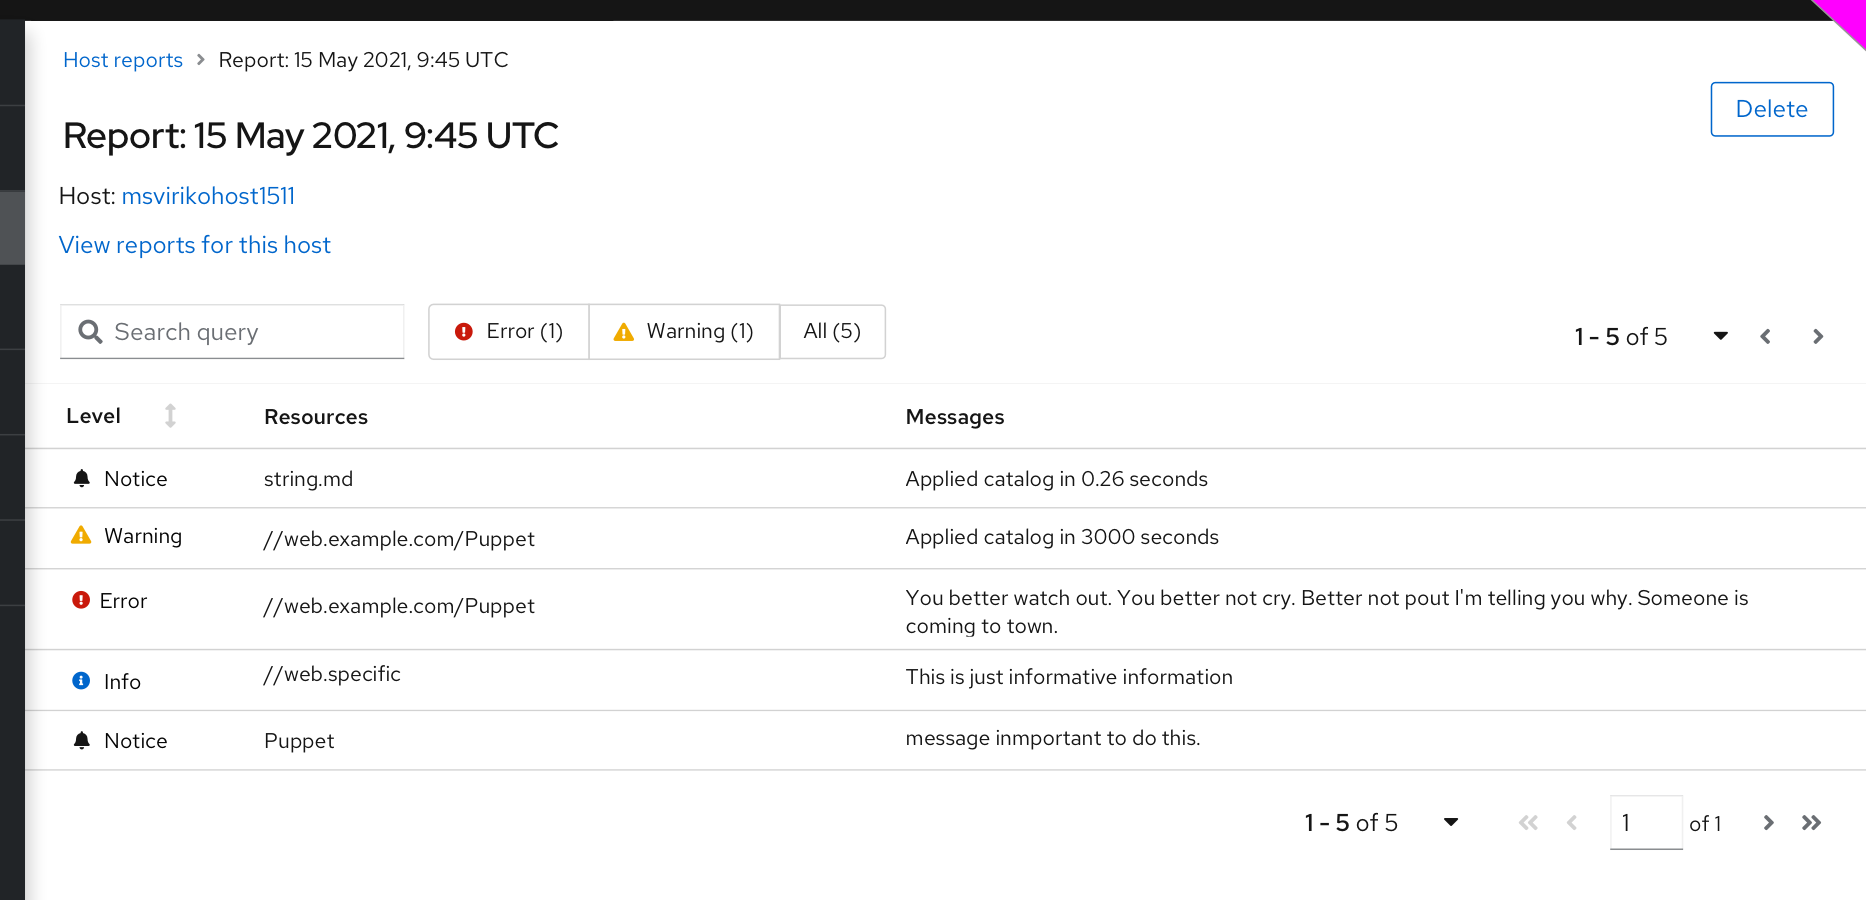
In the table header, I think we could also show numbers for each status, e.g.:
Applied (2) Failed (1)
I assume by clicking on these we would filter these out similarly to level.
Other than that, I love the new design. It is simple, less things on the page. Can people with Puppet reports experience confirm we should really drop all those graphs and metric tables?
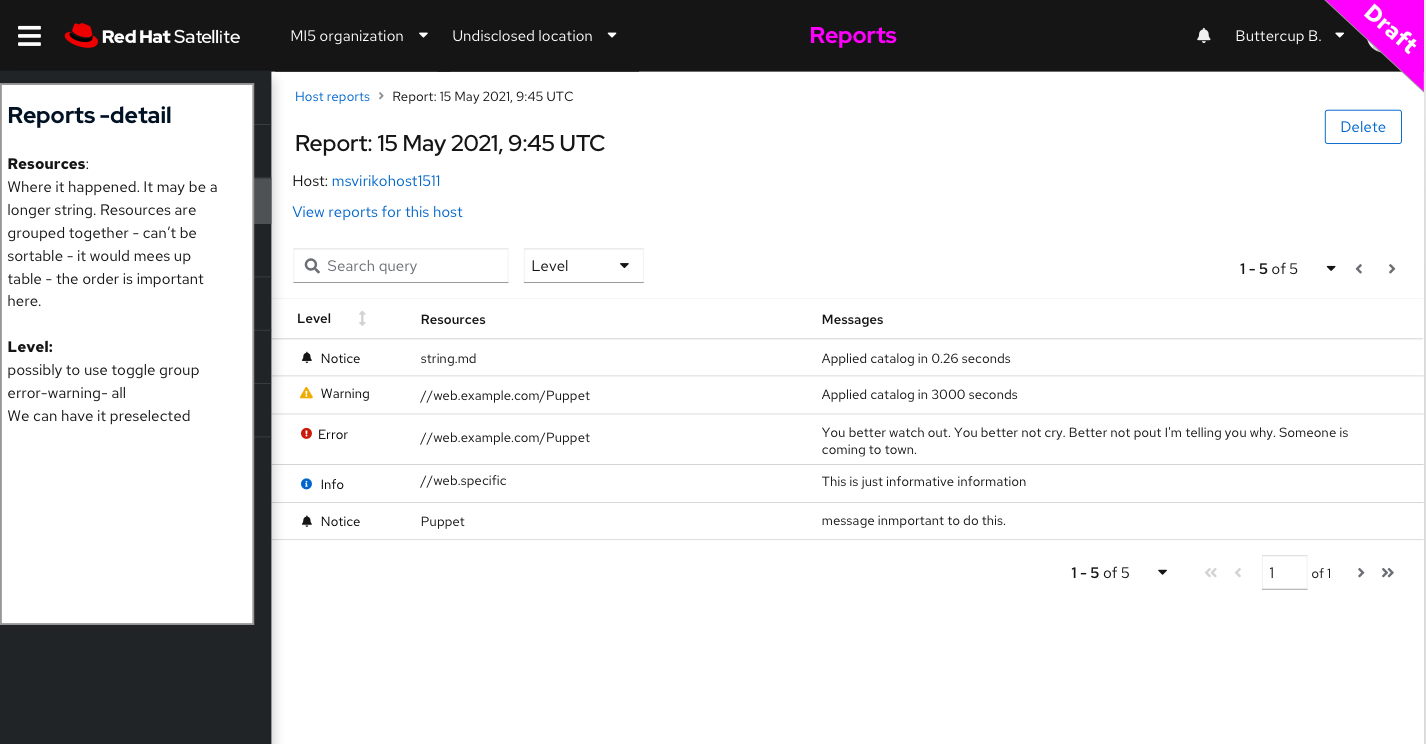
One detail - in the Resource page, the content will be something like /x/y/z/manifest.pp rather than report type (Ansible, Puppet). This is a report detail page for a Puppet.
Something I’ve noticed in my usage patterns is that you often have a resource that fails (at the error level) but then has detailed output at the notice level. If you limit it to only errors, see the error and then show all again, you’re probably lost where you were.
I also wonder what Warning does. Does it only show warnings?
If anything, I think a slider the the minimum level makes much more sense. Then you can show all warnings and errors, but not info and notice.
Something I would find much more useful (for long reports) is a Jump to next Error/Warning button.
As for search: I think ctrl+f is just as useful and doesn’t take up UI space.
I also think we should drop pagination. It’s an anti-feature here. Maybe you’re mislead by showing of a table, but this content is more like a document that you read (it just happens to be structured). With pagination you can split up some message in the middle.
I think that while Puppet and Ansible use similar names for their status tags, the semantics of those tags and their operational signficance is very different. For example, skips often indicate resource dependency failures and Puppet and that usually means a code or operational problem, while in Ansible skips are common due to not testing true on “when” conditions, which is often designed. It would be confusing to me as a (Puppet) user what happened to the other status types I’m used to seeing. Additionally, someone would have to make editorial decisions about how to map the native statuses in the different config management systems to the three categories listed (applied/failed/other).
I agree with @ekohl’s observation above that for Puppet you generally need to see all the messages to be able to figure out what happened (which is the main reason that I think most users would want to use this page; in general when I’ve used this page it has been for troubleshooting problems).
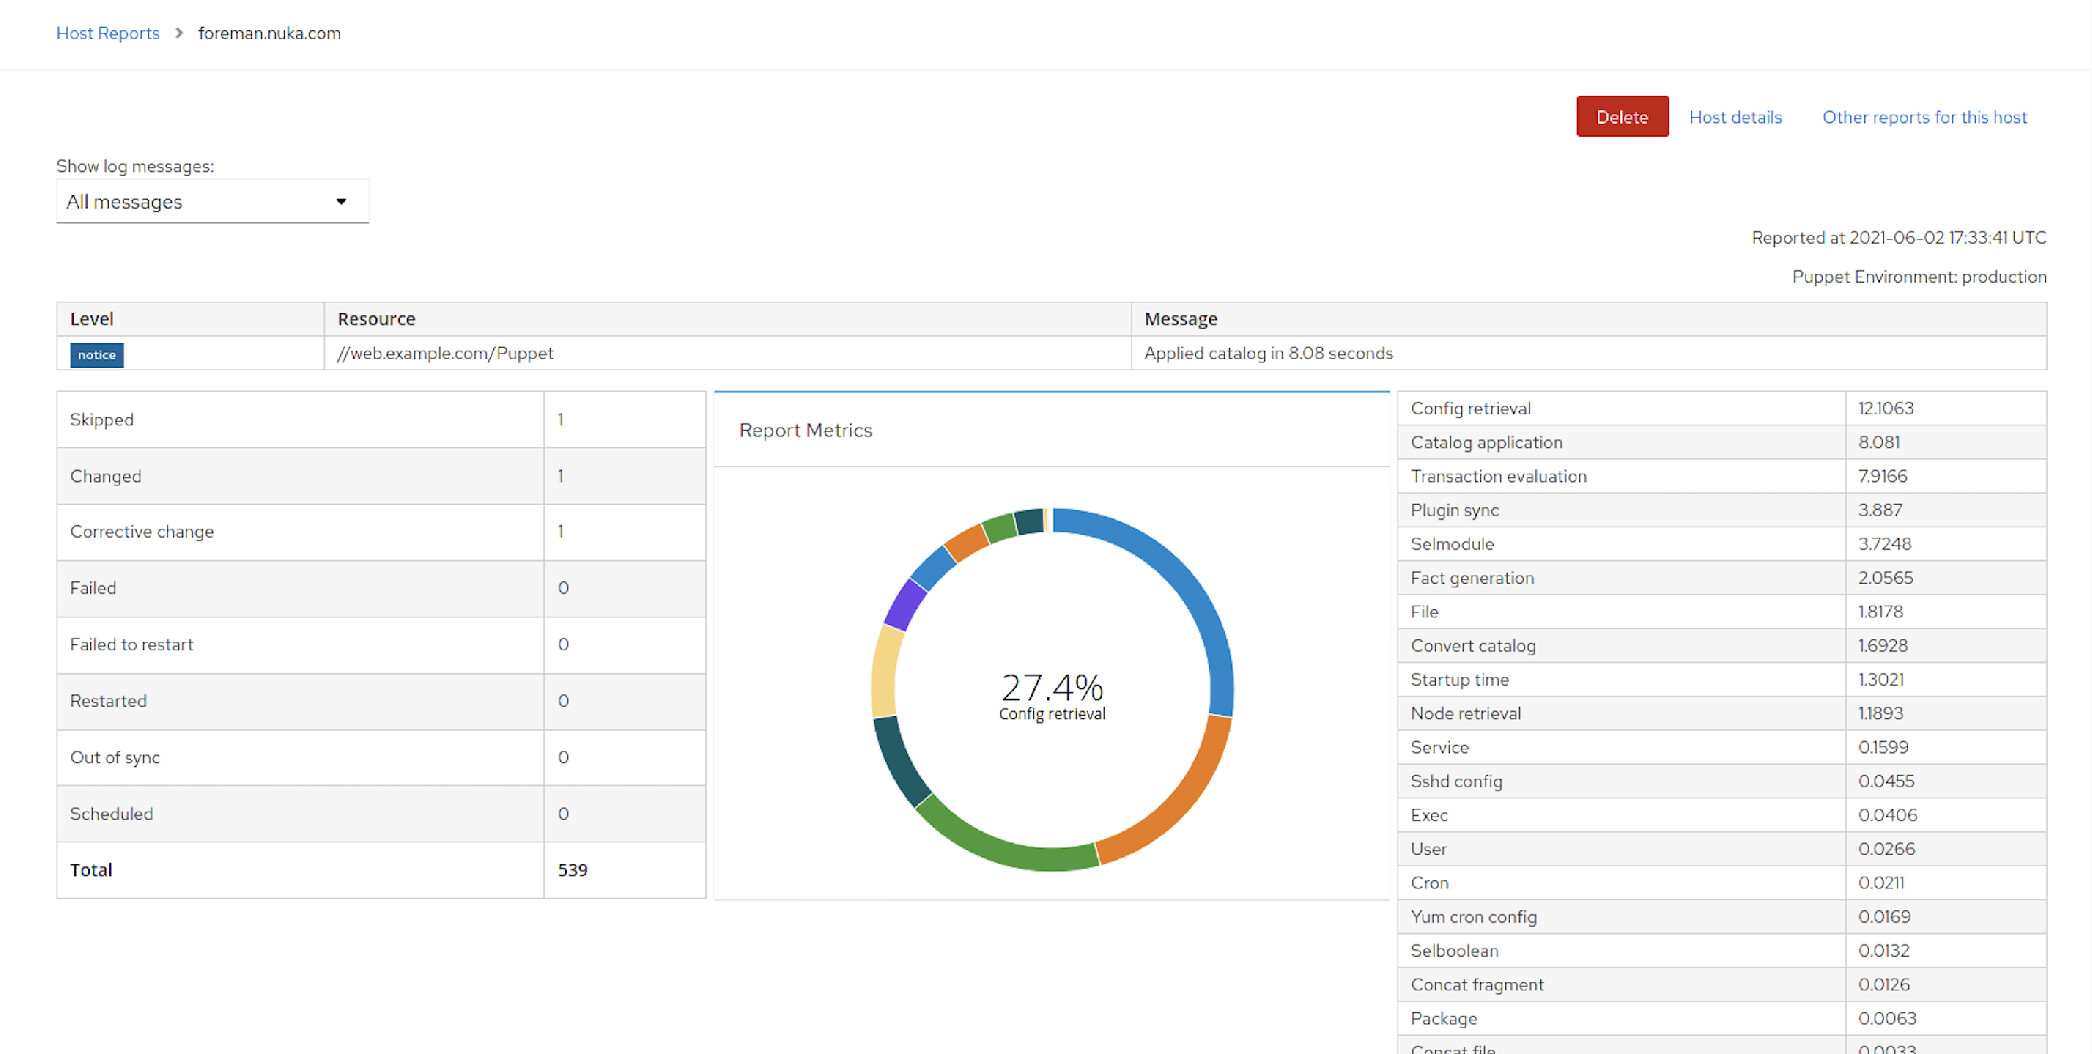
There are reasons to be interested in the timing metrics of reports - in large installations, especially when a lot of generated resources are in use, wildly varying catalog application times can be a concern - and the breakdown by resource type is very useful. I’m not saying that that info needs to be on this page (for example, if that data is preserved, and a report template can access it, that would be sufficient for that case). But in genera, I agree that the bar graph isn’t especially useful. For the limited case where catalog application time is a concern, the circle graph is useful and in some cases would be missed.
We can add something like “Errors with context” that would show N before/after lines like grep does.
I don’t know, I see nothing wrong with the dropdown.
I created a ticket for this, but only if we have time.
While I agree, pagination can be set to a big number so it is only used when a report goes out of control. Does the table component even support non-pagination mode @Ron_Lavi ?
We should remove search bar if we drop pagination, otherwise we need to keep it.
I lean towards keeping pagination/search but defaulting to 1000 lines or something reasonable. Use case: you load a report and it shows everything by default, thanks to pagination, very long report would load faster. You would use search/filter anyway to narrow scope, so overall, I find it useful.
We do not show status tags on the detail page. On the index page, we actually plan to show different tags for different report types in a single column (that is the proposal I have):
puppet type tags - applied:10 failed:1 restarted:2
ansible type tags - passed:10 error:2
(I made up these tags I do not remember them)
Noted. There could be another page per report with this.
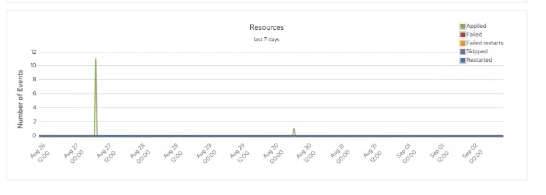
I just realized one more thing - report charts are also present on a very important page - host detail.
If we choose to drop the data, we would need to drop charts from both report and host as well.
It is a big step, perhaps making a survey with @mcorr could give us more insights? I keep hearing from multiple sources that they are useless, @mhjacks is perhaps the first one to find them useful.
It is not big deal to keep them it is just the right time as we are refactoring reports from scratch to drop them if they are not really useful to most users. Or simplify it or make it more useful for non-puppet users too.
When we talked about the Puppet extraction, we’ve also talked about the need to refresh the host detail page. I know @amirfefer started on this, but I don’t know the progress. The goal was to also allow unification with Katello’s Content Host page.
I just realized one more thing - report charts are also present on a very important page - host detail.
If we choose to drop the data, we would need to drop charts from both report and host as well.
I, @Marek_Hulan, and @laugmanuel have already discussed partial Puppet support in the Host detail page (as its own tab). We are going to discuss design and content changes (e.g. ditching charts - currently displayed on host detail page) with a wider public and other customers as well in upcoming weeks.
@ekohl We are working hard to deliver a unified and fully implemented Host detail page in 3.1 in experimental mode (but as a default page with the ability to switch to the old UI)