RFC: Tracking provisioning progress of hosts

RFC: Tracking provisioning progress of hosts

Problem

After host creation, users don’t have an easy way to track provisioning progress from the UI. They have to wait until the callback home happens (TODO Link), which sometimes doesn’t occur, leaving users uncertain about what and where went wrong.

Proposal

Introduce a new API endpoint allowing callbacks from the provisioned machine to the Foreman and report the provisioning steps (PS).

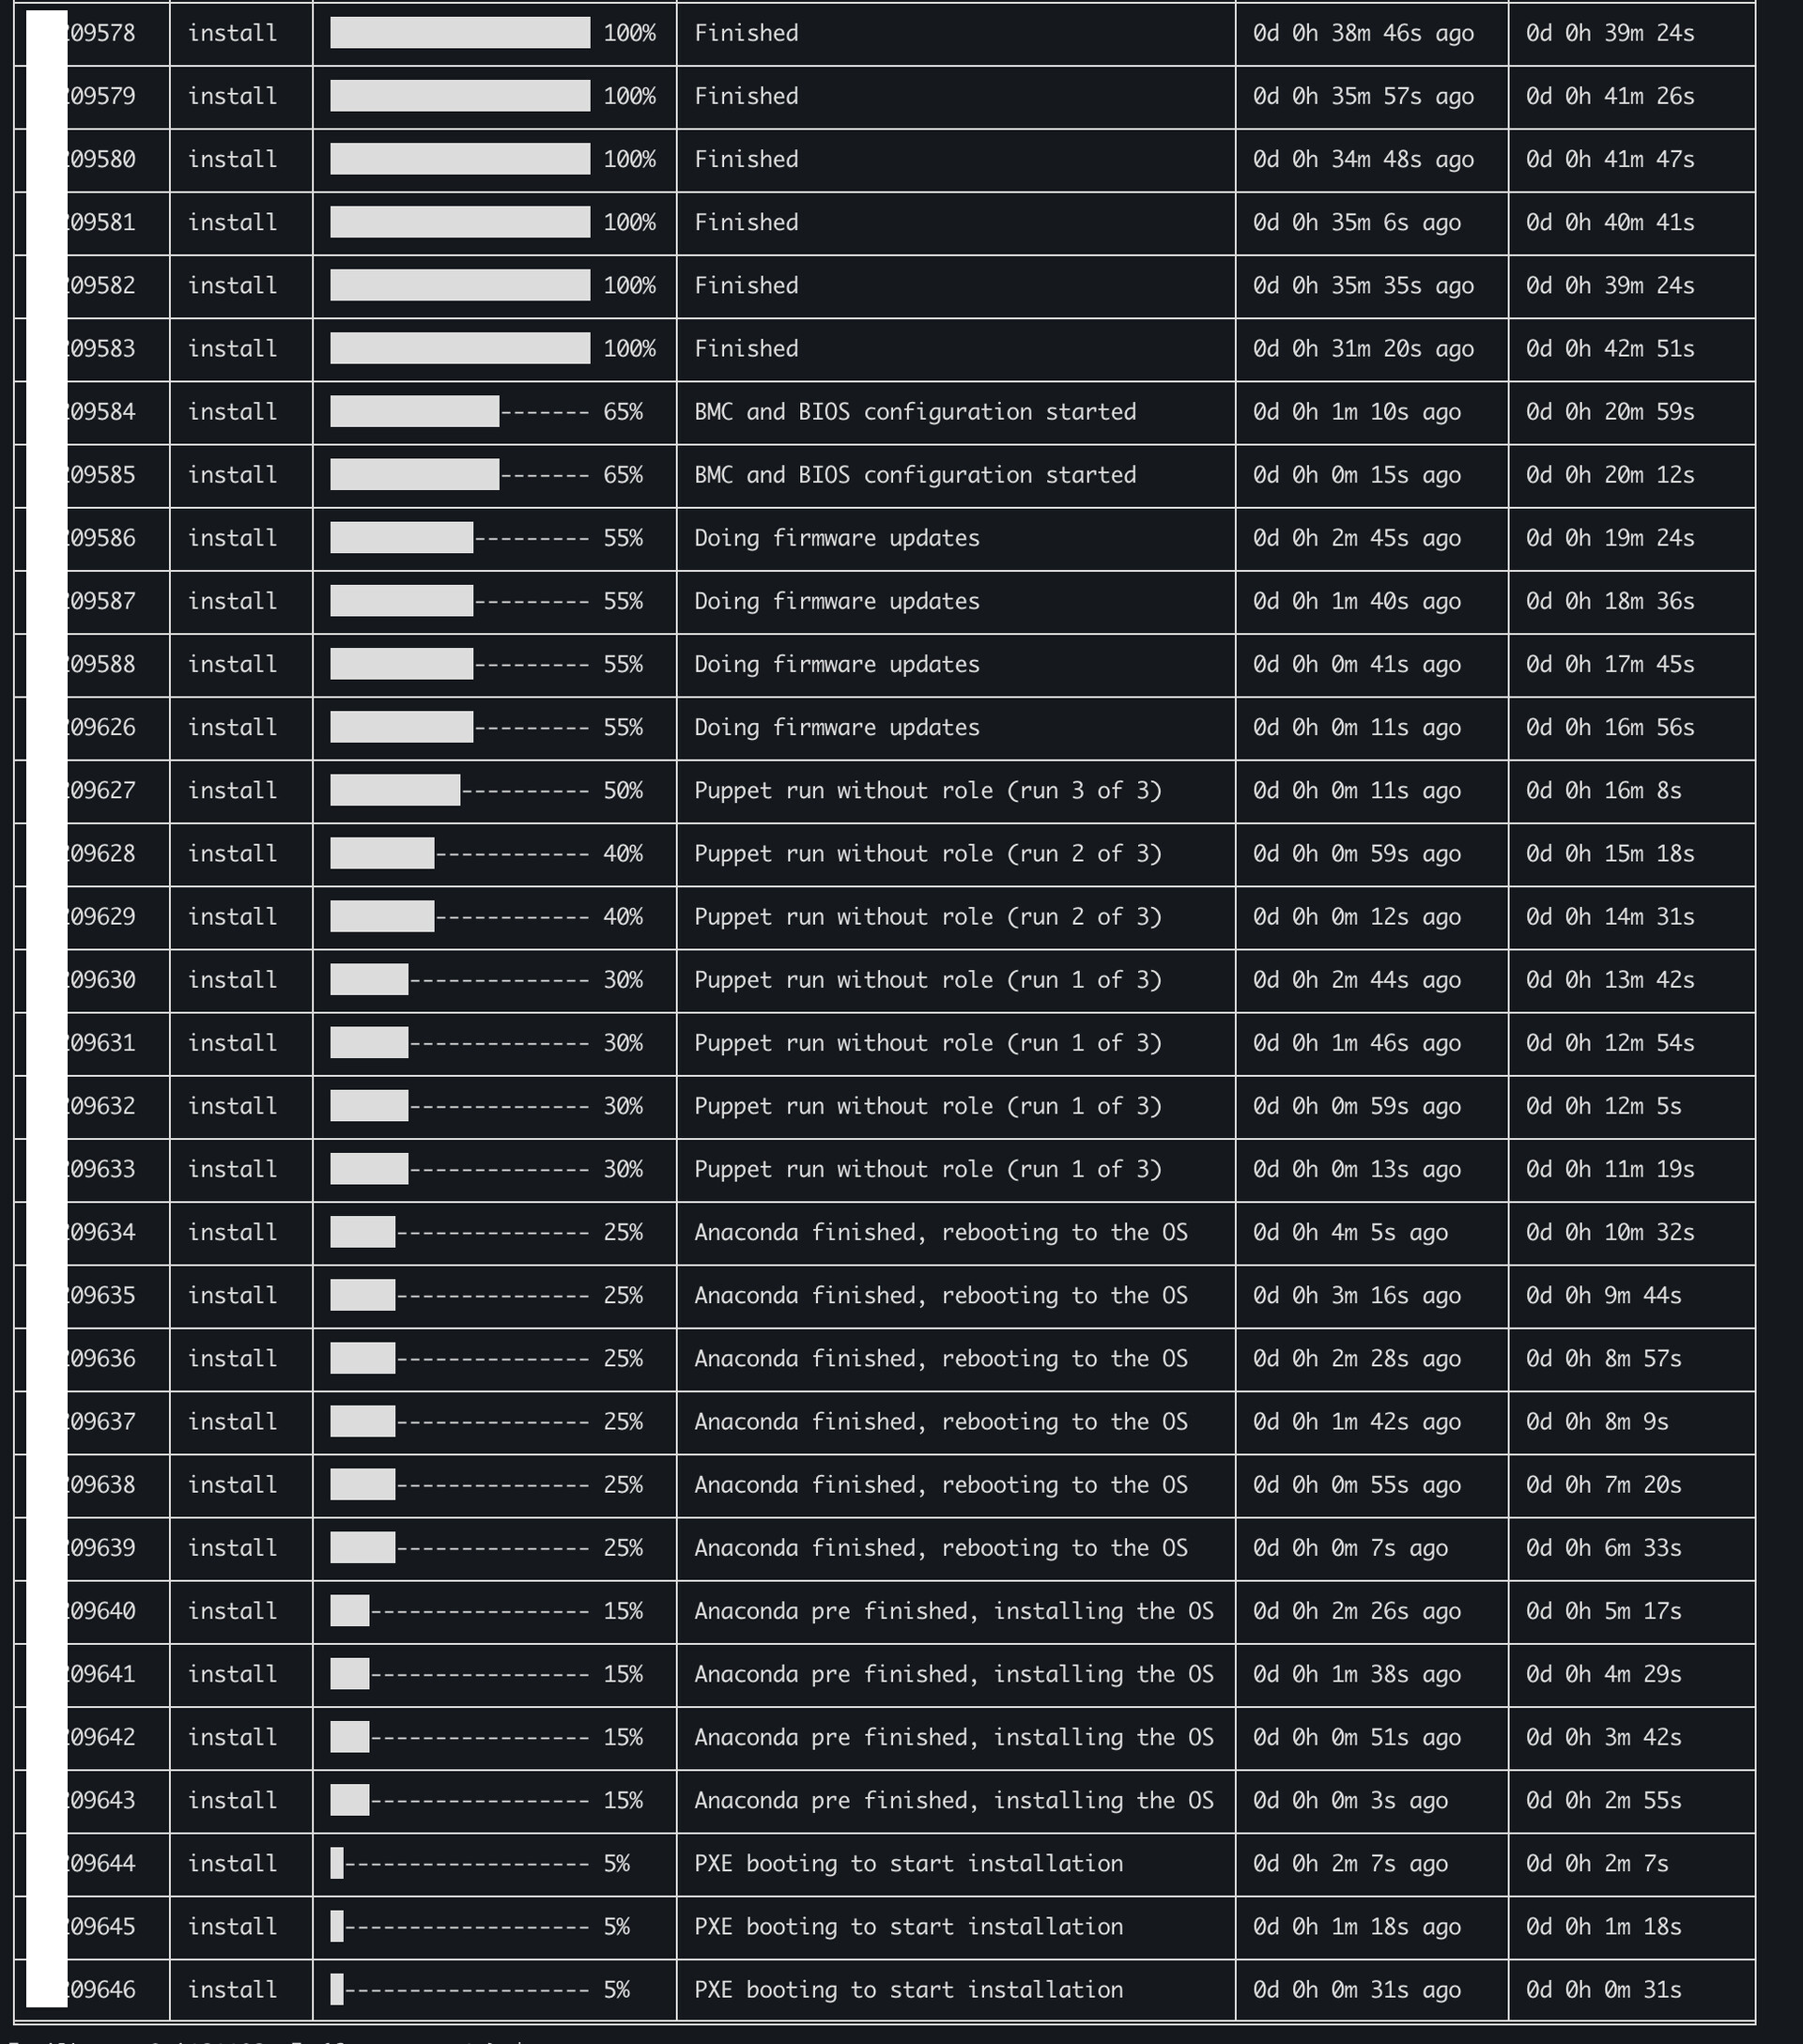
On the Host UI, we can then show the provisioning progress like this:

Implementation - design

I’ve been thinking about two variants of the reporting: simple and detailed.

Simple

We report only the name of the step, label, date/time, and priority. It’s reporting that “something happened,” but we don’t know the results.

Detailed

We report all of the above, plus we can introduce a status. With this, we could report when the step started, ended, or failed.

This would benefit users, but it also means reporting each step twice (start and end), generating quite a lot of requests and log noise. Performance is a drawback of this implementation.

Implementation - code

Action items

  • Create an endpoint (or customize an existing one) to track the provisioning steps.

  • Authentication logic will be the same as that of existing unattended endpoints.

  • Update templates: Add callbacks from the kickstart template and others.

  • Create a template helper to generate the code.

  • Smart Proxy is doing a lot of stuff; we could introduce code helpers for reporting to the Foreman.

  • Implement FirstBoot systemd service; see RFC - Systemd first boot service for host provisioning.

Defining steps

Strict
Foreman and its plugins define all provisioning steps. Reporting an unknown PS will result in an error, not interrupting the provisioning process.

Loose
We could scratch all of that above and just have the reporting “free”.
We allow users to report whatever they want, without strict definitions of statuses and priorities.
With this, we can list all reported steps by date on the Host page and group them by the label. Less code for us, and more freedom for the users.

For both cases above, Foreman will allow reporting status multiple times per host. This can be helpful in case of an error that is causing an endless reboot loop. When users see several steps reported multiple times, they can intervene faster and fix the problem.

Provisioning Step parameters

{
  "name": "Kickstart download",
  "label": "get_ks",
  "priority": 0,
  "status": ["init", "done", "failed"],
  "logs": "..."
}

Looking for inputs

  • What implementation design do you prefer?
  • Do you have any comments on the code implementation?
  • Any other ideas for improvements?
  • What are the user or customer expectations, and what might they need?
1 Like

I’ll start here with a bit of the obvious question:
Do we know the actual user stories for it? What information are the users actually looking for? What pieces of data will help the user to have the information they need?

I think the technical discussion of “how do we get that specific piece of information” should come after we identified what information we actually want to reflect to the user.
For example, do we actually need to report the progress of the template execution? Do we want to report only start or finish of template execution? Do we want to report status/outcome of the execution? We can easily get lost on all of this data, and I suggest to focus on data points that are actually useful to the user.
Maybe all we need is boot loop detection instead of more detailed process reporting.

3 Likes

Easily identifying where a problem in the provisioning process would be good, but with all the different ways of provisioning, capabilities of the different OSes, compute resources, etc. I think it would be quite difficult to get for every option all information. For example you can not run scripts during provisioning when the installer only allows for a post script.

But a first step could be keeping the “loading bar” information we have now but which are only showing pre steps and show them until we have the post step callback running (or even until the first config management report is received when one is configured). Making then log entries and/or relevant configuration for those steps available in the UI could be a next improvement for debugging.

1 Like

Do we know the actual user stories for it?

Yes. Users want more information about provisioning progress. Build / not build is not enough.

What information are the users actually looking for?
What pieces of data will help the user to have the information they need?

Anything is better than the actual state, which is nothing.

For example, do we actually need to report the progress of the template execution? Do we want to report only the start or finish of template execution?

We can leave that up to users, see the “Defining steps > Loose”. We can pre-define some basic endpoints, and the rest leave up to users.

Maybe all we need is boot loop detection instead of more detailed process reporting.

That was just one example; it doesn’t solve the problem I’m describing here: People have zero information; let’s give them something.

I think it would be quite difficult to get for every option all information

We don’t need that. We need to get at least something. See the _ Implementation - design > Simple.

But a first step could be keeping the “loading bar”

+1 to all of that. First, we can track the stages and then (later) think about logging the details. And a progress bar in UI is definitely something we can do.

This would be my preference for the reason @Dirk gives: we support many different ways of provisioning and even within the same OS family the versions may be wildly different.

I think most sysadmins are used to reading logs more as a stream of information (like syslog). Users can add logging lines in their kickstart templates around important steps. If %post is very long, they can log multiple times.

It probably isn’t nice to show this as audit lines, but I’d treat it as a sort of provision log. I also wouldn’t wipe it after a host is entering build mode. That way you can see boot loops. If you want to be fancy you could even automate that. Look at when the host entered build mode and see if the same message was logged twice (or more).

All of that is driven by orchestration on Foreman. Historically communication has always flowed from Foreman to the Smart Proxy and communication the other way is only really present in some modules. I’d like to keep that small.

Remember the Smart Proxy only prepares external services (DHCP, TFTP, DNS) so it only knows if those operations succeeded. The REST API call gives that feedback already and there is no background processing.

What you may be looking for is the logs from the actual services, but that really is tricky. Especially if they’re somewhere on the network. I’d keep that out of scope, at least in the initial implementation.

Yes, a rebuild or a successful build would start the cleanup.

Remember the Smart Proxy

Yeah, the involvement of the Smart Proxy is still WIP, need to dig in to see the possibilities and risks.

Just sharing my approach in case it helps or sparks ideas.

I ended up building a simple daemon that accepts updates (which it writes to a SQLite file) and includes a status command that lets me query by machine(s) name or datacenter.

From Anaconda, I just send callbacks using curl like this:

curl -sS -m 10 -X POST http://foreman:5000/api/update -H "Content-Type: application/json" -d "{\"name\": \"<%= @host.shortname %>\", \"datacenter_name\": \"<%= @host.domain.name.split('.').first %>\", \"action\": \"install\", \"status\": \"Anaconda pre started\", \"percentage\": \"10\"}"

It’s ugly but it works.

The status tool:

usage: status [-h] [-dc DC [DC ...]] [-m M [M ...]] [--all]

Fetch status of machines.

optional arguments:
  -h, --help       show this help message and exit
  -dc DC [DC ...]  List one or more datacenters to filter by.
  -m M [M ...]     List one or more machines to filter by.
  --all            Include all historical data (up to a month).

Here’s what it looks like. The screenshot is not showing the columns, but they are:
Machine | Action | Progress | Last message | Last update sent | Total duration

This setup has been super useful for tracking the many machines we provision. I’ve also started sending back basic failure messages (like if we are missing a disk for doing the HW Raid in %pre) so we can get better visibility into what’s going wrong when something fails.

Next on my list is using the “last update” timestamp to detect when something is stuck. For example, if PXE boot was triggered and nothing happened after 15 minutes, that’s a sign something went wrong and should be flagged.

Hope this helps!

2 Likes

Looks very helpful indeed. But it is Anaconda only, correct? Because with Anaconda we have the must capabilities I think, other installers can not run scripts at all during installation, so we could unfortunately not get all this details.

Correct, we’re using Anaconda only. But I think we could still start with something simple on the Foreman side, like an endpoint we can send updates or messages to.

Later on, we could add basic callbacks in the provisioning templates that support it and use that for a progress bar? And for other steps, like PXE boot, maybe the smart proxy could send a message back to Foreman when the client downloaded the image so we know PXE worked.

I know it won’t be that easy, but we’ve got to start somewhere :smile:

This is very much what I had in mind as something we’d build into Foreman itself so it’s nice to see a reference. My idea was to have some easy way (provisioning macro?) to generate a command to send that output.

From https://www.debian.org/releases/stable/example-preseed.txt

# This first command is run as early as possible, just after
# preseeding is read.
#d-i preseed/early_command string anna-install some-udeb
# This command is run immediately before the partitioner starts. It may be
# useful to apply dynamic partitioner preseeding that depends on the state
# of the disks (which may not be visible when preseed/early_command runs).
#d-i partman/early_command \
#       string debconf-set partman-auto/disk "$(list-devices disk | head -n1)"
# This command is run just before the install finishes, but when there is
# still a usable /target directory. You can chroot to /target and use it
# directly, or use the apt-install and in-target commands to easily install
# packages and run commands in the target system.
#d-i preseed/late_command string apt-install zsh; in-target chsh -s /bin/zsh

You could probably use those to run similar curl commands. I think Preseed and Kickstart are the primary installation methods, though Ubuntu’s installer is another one.

Hi @gms ,
thanks for sharing, it looks great.

It’s very similar to what I have in my mind:

  • Add new endpoint for reporting the status, datetime (& details)
  • Display progress & host detail page
  • Add a template macro that will generate code for reporting the status (curl / wget)