Slow Performance in GUI for "Role Users"

Problem:
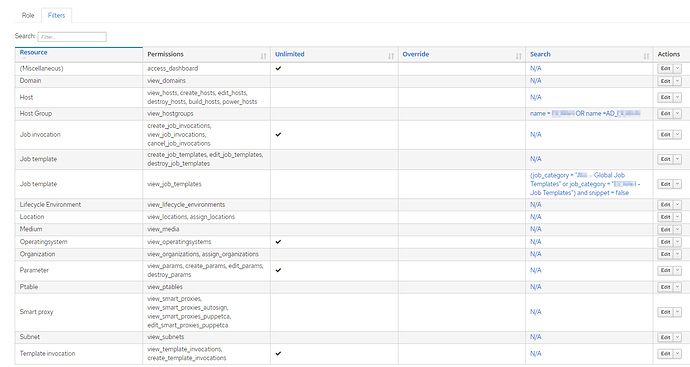
We’re using roles on a heavily basis to limit the visible items in Foreman for our admins worldwide. In general this works quite well, but there seems to be a performance problem with the used “role filters”. Some sites (e.g. Partition Tables) won’t open at all, others just get opened very slowly (e.g. Job Templates).

With top you can then see a postgres process running at 100%CPU after clicking on one of the menu items.

We’ve already extended the amount of CPUs of the (virtual) server and I’ve also tried to adjust some settings in the postgresql.conf…without any success.

The issue only occurs for users that are using a specific role (with several filters configured). For “admin users” we do not experience any performance issues.

Expected outcome:
The performance of the Foreman GUI should be the same for “role users” as for admins.

Foreman and Proxy versions:
Version 2.5.3
Foreman and Proxy plugin versions:

Distribution and version:
CentOS Linux 7
Other relevant data:
The Foreman server currently has 8 vCPUs and 32 GB memory assigned.

Screenshot of top (after clicking on “Partition Tables”):
Foreman_Performance_Problem

Screenshot of our Role Filters:

Hello,

can you enable slow queries reporting (e.g. slower than 5 seconds) and pastebin those queries which are slow?

Edit: What I mean is log_min_duration_statement = 5000 feature in postgres itself.

This looks like Bug #33763: Authorization generates inefficient SQL query for taxonomy-overriden permissions - Foreman, which is actually an issue with how scoped_search generates the sql for the autorization query. https://github.com/wvanbergen/scoped_search/pull/211 should fix that once it’s merged.

As an interim step, you may be able to speed things up a bit by cleaning out old audits by running e.g. rake audits:expire days=7 if you do not require preserving them for a long time. (The reason is that audits are also added to the taxable_taxonomies table which connects between various resources and the locations and organizations.)
Alternatively, you could add an index on the taxable_id field in the taxable_taxonomies which would also speed up the queries until the root cause is resolved (but don’t forget to remove it once it is).

SELECT "templates"."id" AS t0_r0, "templates"."name" AS t0_r1, "templates"."template" AS t0_r2, "templates"."snippet" AS t0_r3, "templates"."template_kind_id" AS t0_r4, "templates"."created_at" AS t0_r5, "templates"."updated_at" AS t0_r6, "templates"."locked" AS t0_r7, "templates"."default" AS t0_r8, "templates"."vendor" AS t0_r9, "templates"."type" AS t0_r10, "templates"."os_family" AS t0_r11, "templates"."description" AS t0_r12, "templates"."job_category" AS t0_r13, "templates"."provider_type" AS t0_r14, "templates"."description_format" AS t0_r15, "templates"."execution_timeout_interval" AS t0_r16, "taxonomies"."id" AS t1_r0, "taxonomies"."name" AS t1_r1, "taxonomies"."type" AS t1_r2, "taxonomies"."created_at" AS t1_r3, "taxonomies"."updated_at" AS t1_r4, "taxonomies"."ignore_types" AS t1_r5, "taxonomies"."description" AS t1_r6, "taxonomies"."label" AS t1_r7, "taxonomies"."ancestry" AS t1_r8, "taxonomies"."title" AS t1_r9, "taxonomies"."manifest_refreshed_at" AS t1_r10, "taxonomies"."created_in_katello" AS t1_r11, "locations_templates"."id" AS t2_r0, "locations_templates"."name" AS t2_r1, "locations_templates"."type" AS t2_r2, "locations_templates"."created_at" AS t2_r3, "locations_templates"."updated_at" AS t2_r4, "locations_templates"."ignore_types" AS t2_r5, "locations_templates"."description" AS t2_r6, "locations_templates"."label" AS t2_r7, "locations_templates"."ancestry" AS t2_r8, "locations_templates"."title" AS t2_r9, "locations_templates"."manifest_refreshed_at" AS t2_r10, "locations_templates"."created_in_katello" AS t2_r11 FROM "templates" LEFT OUTER JOIN "taxable_taxonomies" ON "taxable_taxonomies"."taxable_type" = $1 AND "taxable_taxonomies"."taxable_id" = "templates"."id" LEFT OUTER JOIN "taxonomies" ON "taxonomies"."type" = $2 AND "taxonomies"."id" = "taxable_taxonomies"."taxonomy_id" LEFT OUTER JOIN "taxable_taxonomies" "taxable_taxonomies_templates_join" ON "taxable_taxonomies_templates_join"."taxable_type" = $3 AND "taxable_taxonomies_templates_join"."taxable_id" = "templates"."id" LEFT OUTER JOIN "taxonomies" "locations_templates" ON "locations_templates"."type" = $4 AND "locations_templates"."id" = "taxable_taxonomies_templates_join"."taxonomy_id" WHERE "templates"."type" = $5 AND (templates.id IN (127,128,129,130,131,132,133,134,135,136,137,138,139,140,141,142,143,144,145,147,148,149,150,151,152,153,154,155,156,157,158,159,160,161,162,163,164,165,166,176,177,178,181,190,191,221,225,226,227,228,229,231,234,235,242,243,245,247,251,254,264,277,278,280,286,313,316,317,318,320,322,323,326,333,335,336,337,344,345,346,351,357,358,359,361,368,369,372,375,376,377,378)) AND ((("templates"."id" IN (SELECT "templates"."id" FROM "templates"          INNER JOIN "taxable_taxonomies"
                  ON "templates"."id" = "taxable_taxonomies"."taxable_id"
                  INNER JOIN "taxonomies"
                  ON "taxable_taxonomies"."taxonomy_id" = "taxonomies"."id"
         WHERE "taxonomies"."id" IN ('5') )) AND ("templates"."id" IN (SELECT "templates"."id" FROM "templates"          INNER JOIN "taxable_taxonomies"
                  ON "templates"."id" = "taxable_taxonomies"."taxable_id"
                  INNER JOIN "taxonomies"
                  ON "taxable_taxonomies"."taxonomy_id" = "taxonomies"."id"
         WHERE "taxonomies"."id" IN ('13') )))) ORDER BY templates.name

This is the query for the “Job Templates”. Unfortunately, I’m not able to add those for “Partition Tables” because it just doesn’t finish.

Thanks for the response. May I ask for further support for the workaround with the index?

Would it be just this statement?

CREATE INDEX taxable_idx ON taxable_taxonomies (taxable_id);

And when the root cause is resolved, I can remove it again with the following command, correct?

DROP INDEX taxable_idx;

that is correct. This index should resolve the issue until the root cause is also resovled.

Thank you very much! I already tried it out and it works! Accessing the “Partition Tables” still needs a few seconds…but at least it is possible.

Could you share the output of running the following command inside the foreman console?

TaxableTaxonomy.group(:taxable_type).reorder('count_all').count
irb(main):001:0> TaxableTaxonomy.group(:taxable_type).reorder('count_all').count
=> {"HttpProxy"=>4, "AuthSource"=>8, "Environment"=>38, "Role"=>52, "Domain"=>70, "SmartProxy"=>103, "Subnet"=>137, "Medium"=>293, "User"=>296, "Filter"=>372, "ReportTemplate"=>418, "Hostgroup"=>634, "Ptable"=>918, "ProvisioningTemplate"=>1016, "JobTemplate"=>2915, "Audited::Audit"=>101173}

That doesn’t sound right… could you enable sql logging and provide the full production.log of a request to load this page (with any private data redacted)? The size of the taxable_taxonomies table should not be an issue with the added index.