The goal of this plugin is to unify the way of showing task statuses across the Foreman instance. It defines Task model for keeping the information about the tasks and Lock for assigning the tasks to resources. The locking allows dealing with preventing multiple colliding tasks to be run on the same resource. It also optionally provides Dynflow infrastructure for using it for managing the tasks.
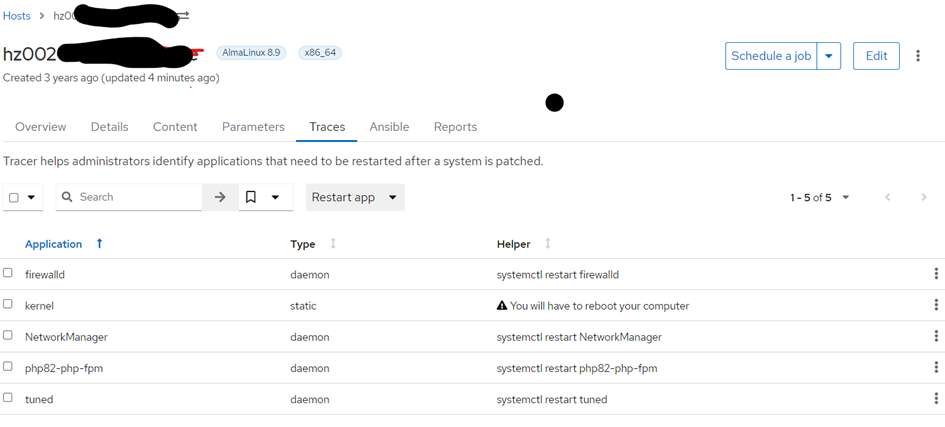
It sounds like the host’s trace status is not up to date. In the web UI, what do you see for the host’s Tracer status? Does it match what you see on the host itself?
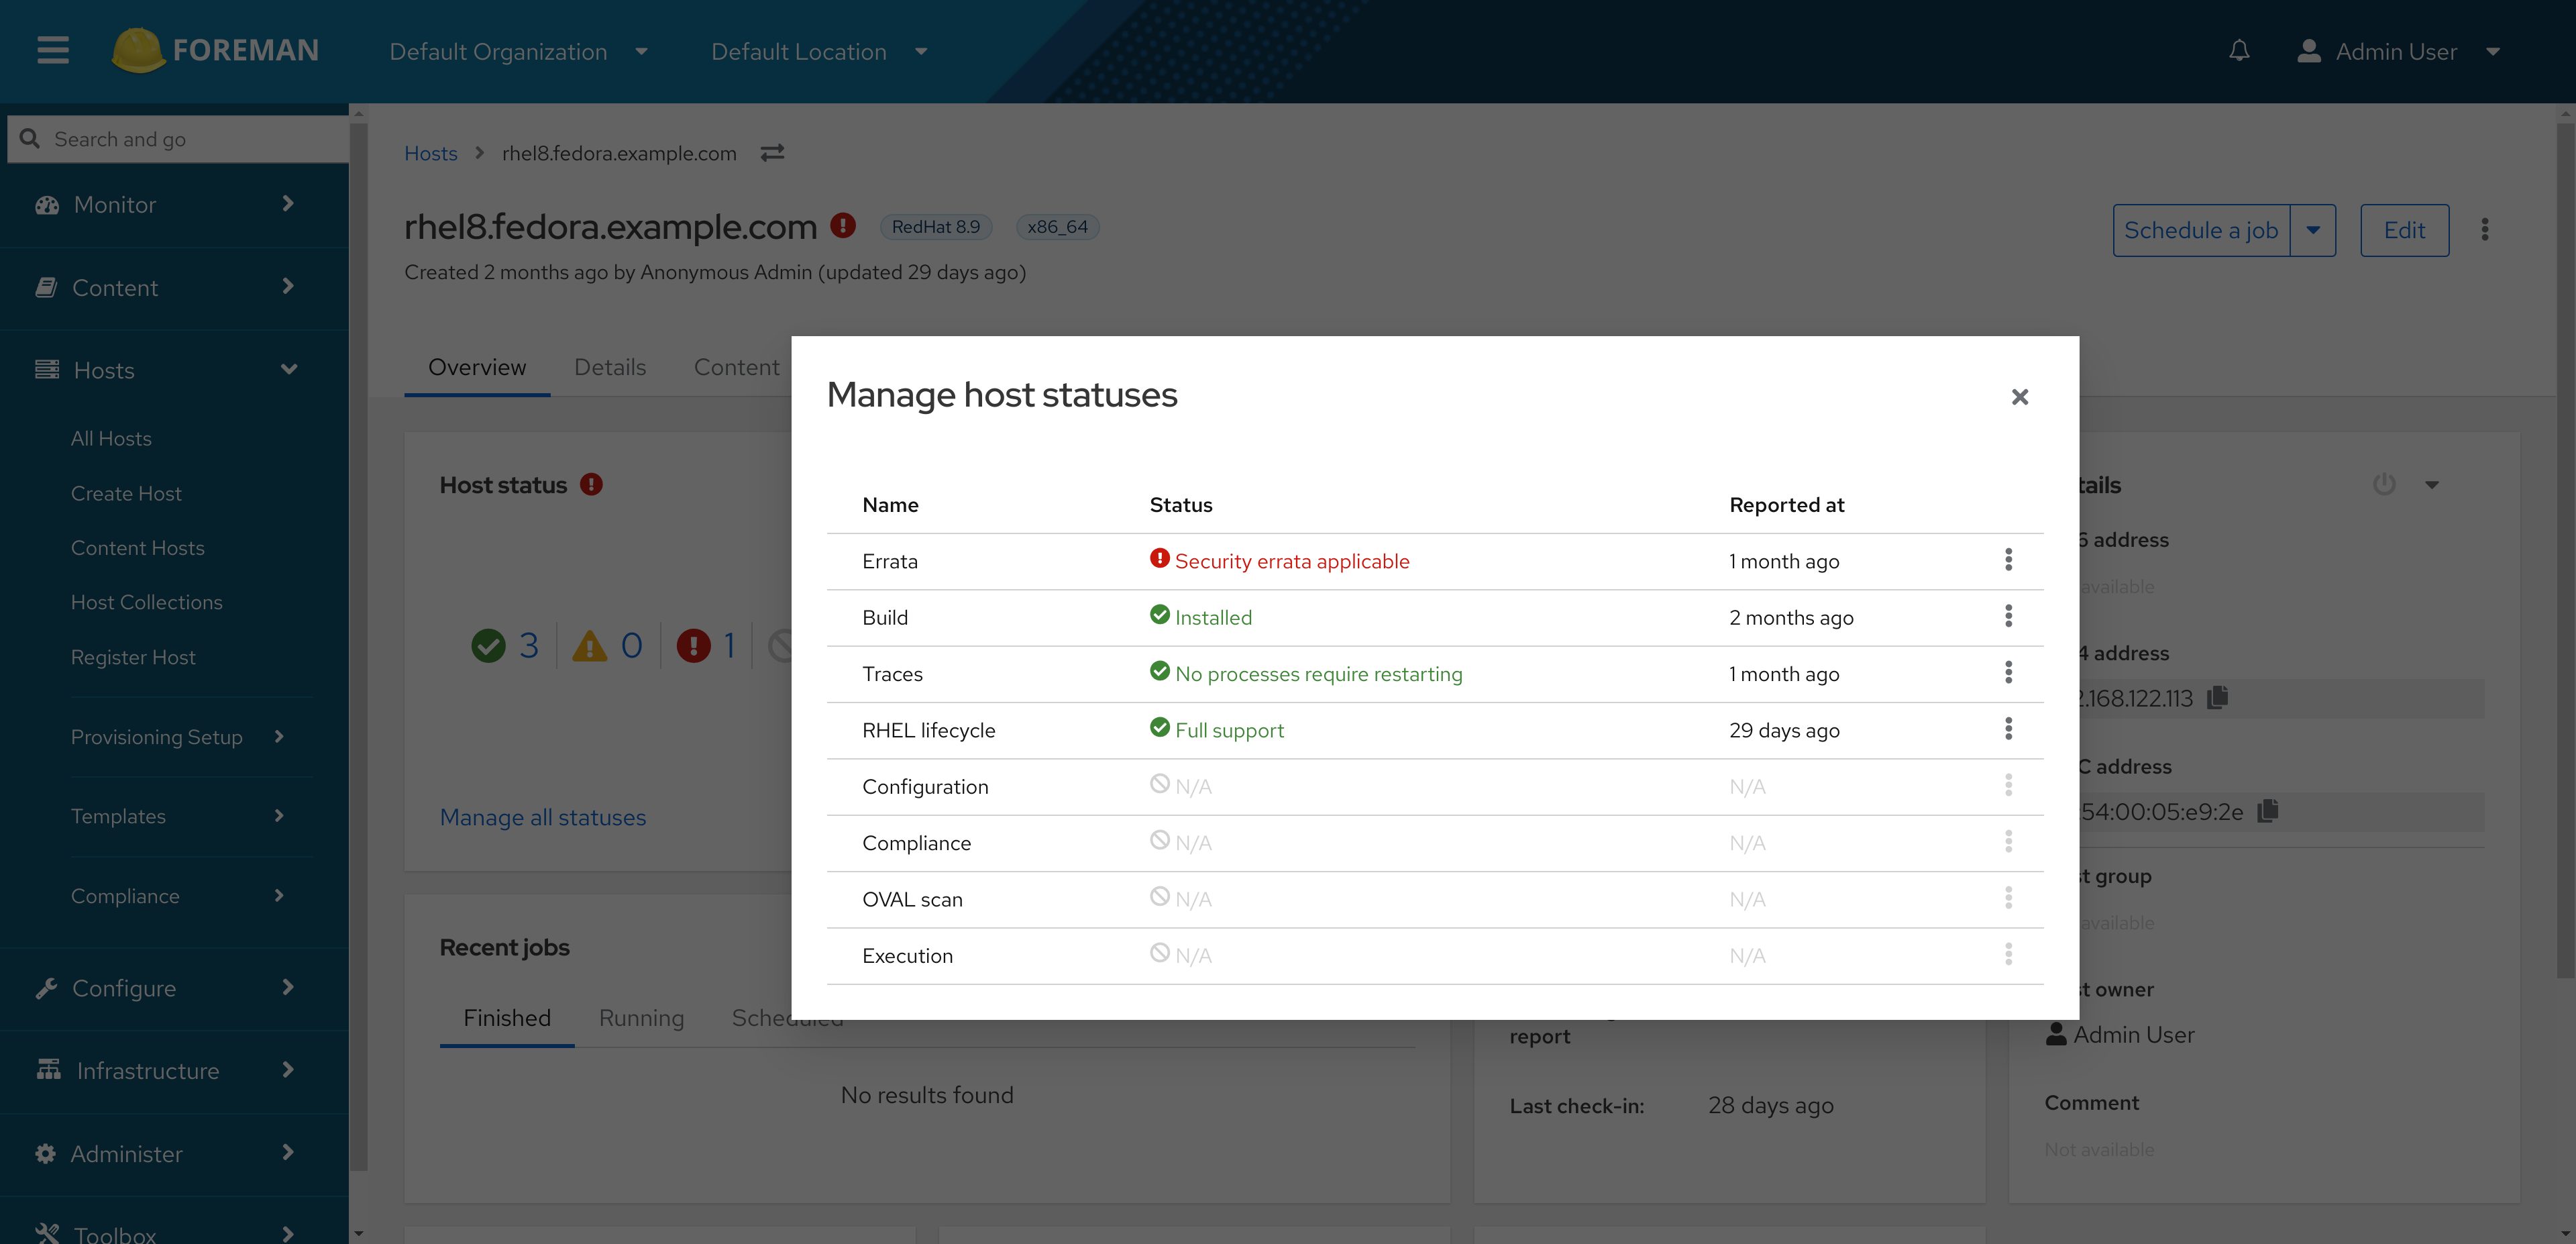
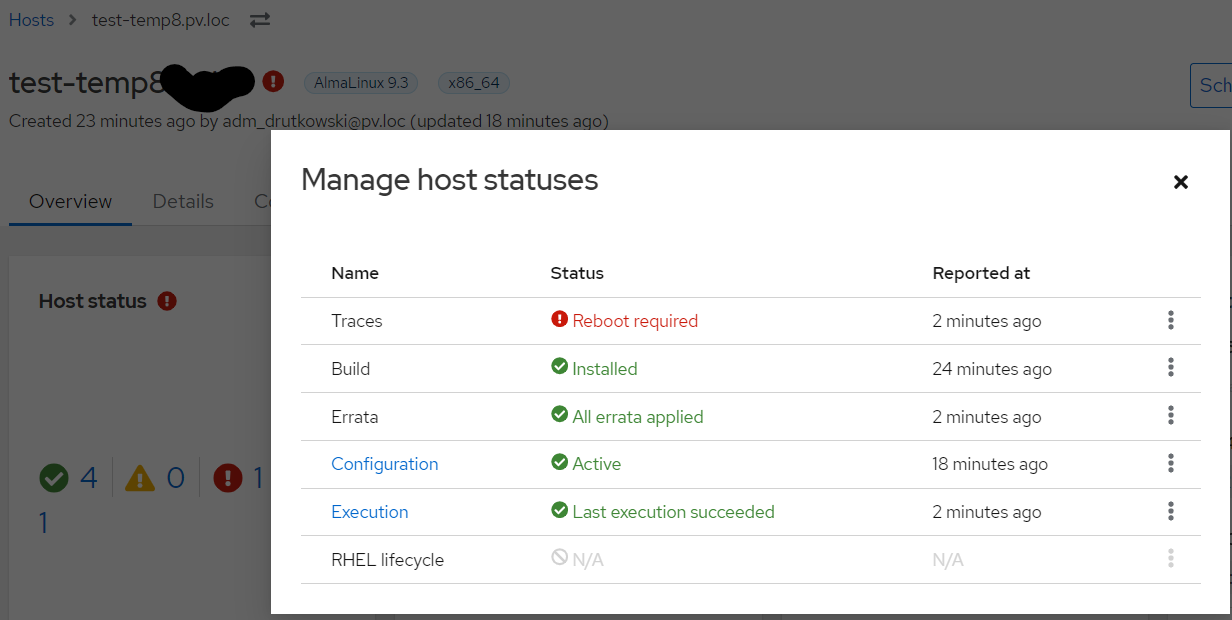
If you click Overview, then on the Host status card click ‘Manage all statuses’, what do you see there? My question was does this status match what you are seeing elsewhere or not. (my theory is that it does not.)
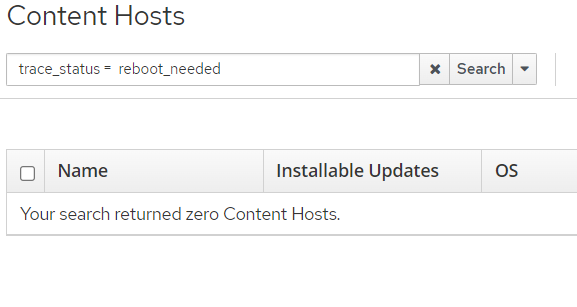
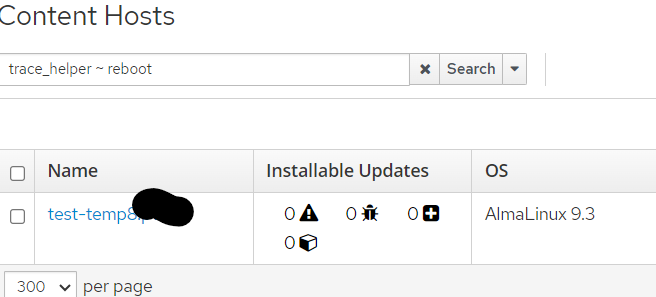
Thanks, this is helpful! This tells me that the status itself is working correctly (and also katello-host-tools is working); it is only the search that is not working.
I have just upgraded to 4.12 on Friday and noticed this, too. The search for trace_status doesn’t work. Neither reboot nor process restart is found. Any chance to get this backported to 4.12, soon?
It’s not targeted for 4.12, but since it’s merged now it shouldn’t be a problem to get it in for 4.13 GA.
IMO to_status is the right place to put load on the database, considering how host statuses are supposed to work: The to_status value is computed, and then saved (cached) in the DB for searching etc. The reason why the host details page was showing the correct status is because it relies on to_status rather than the stored status value, which, one could argue that’s what’s not correct. In any case, we’ll keep an eye on it and please report if you notice any slowness.
As to what changed, I’m still not sure. Maybe Rails itself changed the rules about when it decides to hit the database for Active Record queries…? Or, the Occum’s razor hypothesis would be that Katello code changed something about when we compute the status, but I couldn’t find any. If you have any other theories, let me know!
Thanks for the explanation. I don’t think I really understand the logic there, but I suppose I don’t have to. I kind of thought that the trace status in database table katello_host_tracers would be accessed. That contains all traces. So you are saying, that that information is cached somewhere else in the database again for access on trace_status?
It is. The problem (I think) is that the value saved in the DB is a stale value.
Looking at it some more, I think the problem may be related to this commit. There we added host_traces to the host’s included associations:
def included_associations(include = [])
 [:host_traces] + super
end
This means that this previous flow
host is loaded in Active Record via any call to a host object
host trace status is computed, triggering a call to to_status and thus host.host_traces
host.host_traces are loaded via a SQL query to the database
now looks like this:
host is loaded in Active Record via any call to a host object. host.host_traces is also loaded via SQL query at the same time, and saved in memory
host trace status is computed, triggering a call to to_status > host.host_traces.
But this time, no SQL query is executed, because host_traces is already in memory.
Thus, that commit altered the moment at which the host’s traces are queried, and introduced the possibility that to_status is computed based on stale data.
foreman=# select a.*,b.name from katello_host_tracers a left join hosts b on (a.host_id = b.id) where app_type = 'static';
   id   | host_id | application |                helper                 | app_type |            name
--------+---------+-------------+---------------------------------------+----------+----------------------------
 187095 |     372 | systemd     | You will have to reboot your computer | static   | host1.example.com
I’ll see currently 117 rows listed, i.e. 117 hosts which need to be rebooted.
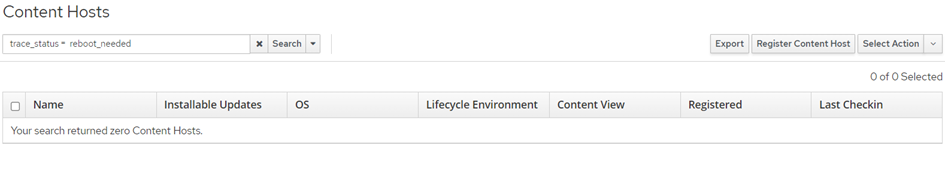
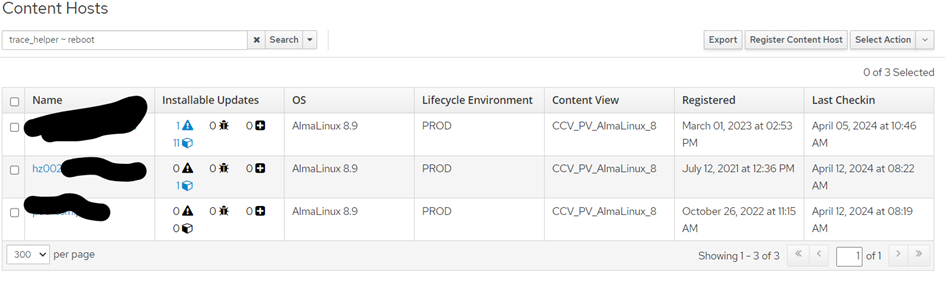
If I search hosts in the foreman gui with trace_status != updated I currently get 3 hosts listed.
If have restarted all foreman services (foreman-maintain service restart). It’s still the same. Thus it’s not in the memory. So I am really puzzled to which SQL query it does to retrieve the host_trace. It doesn’t seem to access katello_host_tracers because that does contain the traces for each host.
And it doesn’t really look like stale data because it’s missing most of the data altogether. Basically trace_status doesn’t know about trace information of those 114 missing hosts.
Right. Any search for trace_status is only querying the host_status table, not the katello_host_tracers table. And computing the status based on stale data causes the host_status table to have incorrect values.
Thanks. Now I have got it. The status column in table host_status contains values 0,1, or 2 for each row with type Katello::TraceStatus. In that table only those 3 hosts have a value other than 0. All others have 0. So that value status in host_status does not match the content of the katello_host_tracers.
It doesn’t look like a particular good idea to store an additional status value in host_status while the real data is available in katello_host_tracers for the exact reason of this issue, when the one value doesn’t match the value of the other table. But then, I guess there must be a good reason for doing so.
Either way, now I know how it works and was able to quickly fix the status in host_status for our hosts. Now it looks good. I hope it stays this way with this patch.