Foreman proxy plugin monitoring with Icinga

Problem:
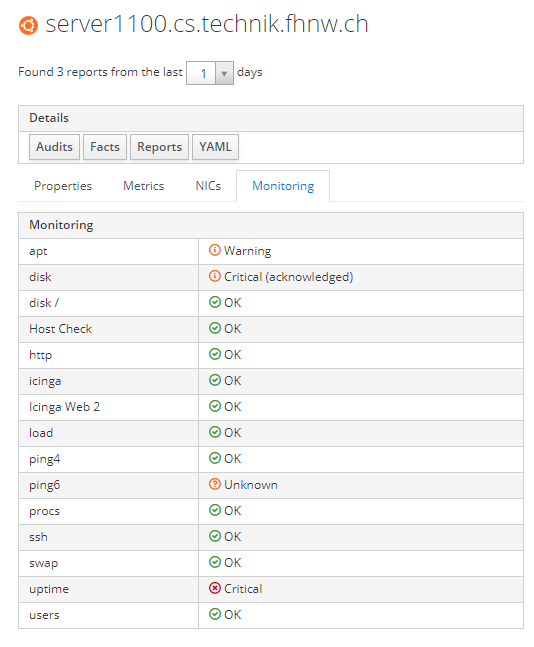
I have setup and configured Foreman plugin smart proxy for icinga monitoring according to the doc: https://github.com/theforeman/smart_proxy_monitoring. But I cannot see the configured hosts from Icinga in the Foreman dashboard.

I am able to use the configured api user “foreman” to run API calls with cURL on the server Foreman is installed. And also I can confirm that the results are non-empty, that’s to say there are hosts to query. Furthermore, the smart proxy creates a connection to the Icinga API and registers a listener (see output at the end).

example:

root@server1100:/etc/icinga2# curl -k -s -u foreman:*** 'https://10.35.147.100:5665/v1'
<html><head><title>Icinga 2</title></head><h1>Hello from Icinga 2 (Version: r2.8.4-1)!</h1><p>You are authenticated as <b>foreman</b>. Your user has the following permissions:</p> <ul><li>*</li></ul><p>More information about API requests is available in the <a href="https://docs.icinga.com/icinga2/latest" target="_blank">documentation</a>.</p></html>root@server1100:/etc/icinga2# curl -s -u foreman:foreman 'https://10.35.147.100:5665/v1'

I’m really lost on what to try next as both components seem to work by themselves but the connection seems off.

I would be greatful for any hints or additional tests I could run to circle in the issue.

Best regards, Nic
icinga and icingaweb
icinga2: r2.8.4-1
web: 2.5.3
Foreman and Proxy versions:
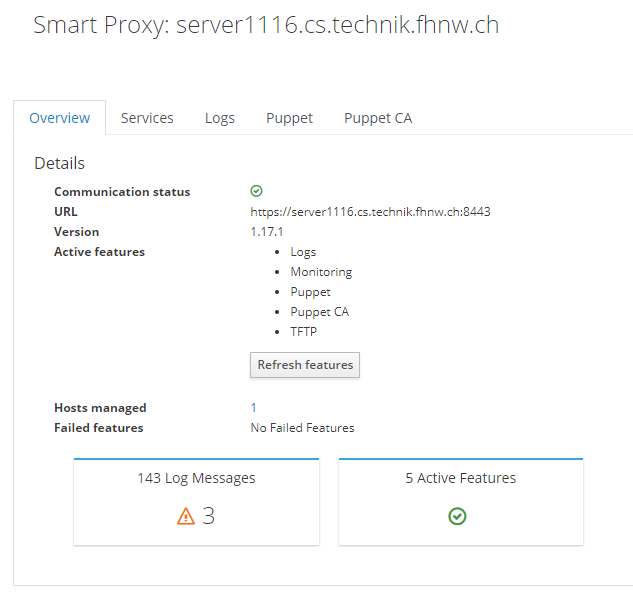
foreman_proxy: 1.17.1
Foreman and Proxy plugin versions:
foreman monitoring: 1.0.1
Other relevant data:

monitoring.yaml

:enabled: true
:use_provider:
  - monitoring_icinga2
  - monitoring_icingadirector
:collect_status: true

monitoring_icinga2.yaml:

:enabled: true

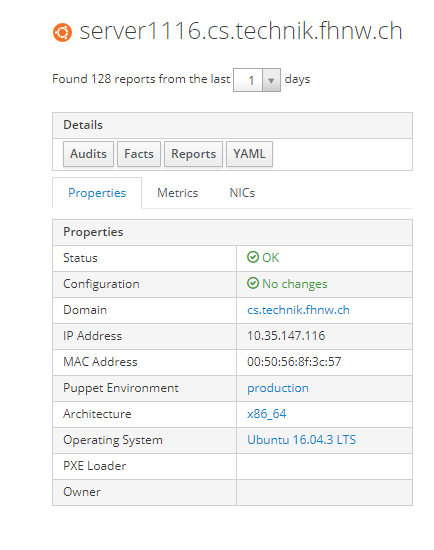
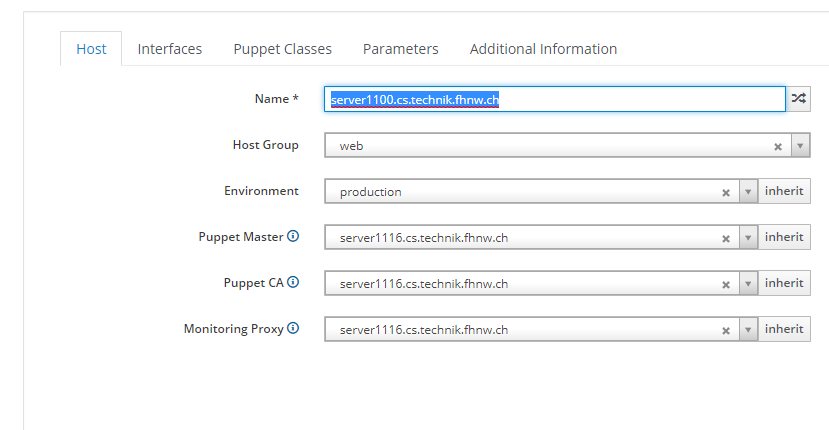
:server: server1100.cs.technik.fhnw.ch
# The CA certificate from icinga2 server
:api_cacert: /etc/foreman-proxy/monitoring/ca.crt
# The name of API User
:api_user: foreman
:api_password: ***
# SSL Verfification mode (boolean value)
:verify_ssl: false

output from proxy.log:

D, [2018-07-13T12:13:06.398754 ] DEBUG -- : 'monitoring' settings: 'collect_status': true (default),     'enabled': true, 'use_provider': ["monitoring_icinga2", "monitoring_icingadirector"]
D, [2018-07-13T12:13:06.398855 ] DEBUG -- : 'monitoring' ports: 'http': true, 'https': true
D, [2018-07-13T12:13:06.402602 ] DEBUG -- : 'tftp' settings: 'enabled': https, 'tftproot': /var/lib/tftpboot (default)
D, [2018-07-13T12:13:06.402674 ] DEBUG -- : 'tftp' ports: 'http': false, 'https': true
D, [2018-07-13T12:13:06.404527 ] DEBUG -- : 'puppetca' settings: 'autosignfile': /etc/puppetlabs/puppet/autosign.conf, 'enabled': https, 'ssldir': /etc/puppetlabs/puppet/ssl
D, [2018-07-13T12:13:06.404582 ] DEBUG -- : 'puppetca' ports: 'http': false, 'https': true
D, [2018-07-13T12:13:06.407636 ] DEBUG -- : 'puppet' settings: 'enabled': https, 'puppet_version': 5.5.2, 'use_provider': [:puppet_proxy_puppet_api]
D, [2018-07-13T12:13:06.407698 ] DEBUG -- : 'puppet' ports: 'http': false, 'https': true
D, [2018-07-13T12:13:06.409698 ] DEBUG -- : 'logs' settings: 'enabled': https
D, [2018-07-13T12:13:06.409754 ] DEBUG -- : 'logs' ports: 'http': false, 'https': true
D, [2018-07-13T12:13:06.409989 ] DEBUG -- : Providers ['monitoring_icinga2', 'monitoring_icingadirector'] are going to be configured for 'monitoring'
D, [2018-07-13T12:13:06.410058 ] DEBUG -- : Providers ['puppet_proxy_puppet_api'] are going to be configured for 'puppet'
D, [2018-07-13T12:13:06.415878 ] DEBUG -- : 'monitoring_icinga2' settings: 'api_cacert': /etc/foreman-proxy/monitoring/ca.crt, 'api_password': ***, 'api_port': 5665 (default), 'api_user': foreman, 'collect_status': true, 'enabled': t
rue, 'server': server1100.cs.technik.fhnw.ch, 'use_provider': ["monitoring_icinga2", "monitoring_icingadirector"], 'verify_ssl': false
D, [2018-07-13T12:13:06.418753 ] DEBUG -- : 'monitoring_icingadirector' settings: 'collect_status': true, 'director_cacert': /etc/foreman-proxy/monitoring/ca.crt, 'director_password': ***, 'director_url': https://server1100.cs.techni
k.fhnw.ch/icingaweb2/director, 'director_user': foreman, 'enabled': true, 'use_provider': ["monitoring_icinga2", "monitoring_icingadirector"], 'verify_ssl': false
D, [2018-07-13T12:13:06.423574 ] DEBUG -- : 'puppet_proxy_puppet_api' settings: 'api_timeout': 30 (default), 'classes_retriever': apiv3, 'environments_retriever': apiv3, 'puppet_ssl_ca': /etc/puppetlabs/puppet/ssl/certs/ca.pem, 'puppet_s
sl_cert': /etc/puppetlabs/puppet/ssl/certs/server1110.cs.technik.fhnw.ch.pem, 'puppet_ssl_key': /etc/puppetlabs/puppet/ssl/private_keys/server1110.cs.technik.fhnw.ch.pem, 'puppet_url': https://server1110.cs.technik.fhnw.ch:8140, 'puppet_
version': 5.5.2, 'use_provider': [:puppet_proxy_puppet_api]
D, [2018-07-13T12:13:06.424606 ] DEBUG -- : Starting initial icinga import.
I, [2018-07-13T12:13:06.424765 ]  INFO -- : Successfully initialized 'monitoring_icinga2'
I, [2018-07-13T12:13:06.424864 ]  INFO -- : Starting Task: Initial Host Import.
D, [2018-07-13T12:13:06.425754 ] DEBUG -- : Connecting to Icinga event monitoring api: https://server1100.cs.technik.fhnw.ch:5665/v1.
I, [2018-07-13T12:13:06.425901 ]  INFO -- : Successfully initialized 'monitoring_icingadirector'
I, [2018-07-13T12:13:06.425966 ]  INFO -- : Successfully initialized 'monitoring'
I, [2018-07-13T12:13:06.426030 ]  INFO -- : Successfully initialized 'foreman_proxy'
I, [2018-07-13T12:13:06.460355 ]  INFO -- : Icinga event api monitoring started.

Hi,

you should see http post requests to api/monitoring_results on your Foreman instance. Do you see them in the log (/var/log/foreman/production.log)?

cc: @Dirk

Timo

I think your configured it correctly and its working fine, but your assumption in what it is doing is wrong. It will not import the hosts from Icinga, only get monitoring data for hosts already existing, identified by fqdn or if you configured hostname stripped from the domain name. Furthermore it will create hosts in monitoring during host provisioning if turned on via settings.

Hi Timo

Thanks for your input. I checked the production log file and indeed there were POST requests entries with susequent error messages, see below:

2018-07-16T08:55:45 c8ace9de [app] [I] Completed 403 Forbidden in 5ms (Views: 1.1ms | ActiveRecord: 0.4ms)
2018-07-16T08:55:45 a187a288 [app] [I] Started POST "/api/monitoring_results" for 10.35.147.116 at 2018-07-16 08:55:45 +0200
2018-07-16T08:55:45 a187a288 [app] [I] Processing by Api::V2::MonitoringResultsController#create as JSON
2018-07-16T08:55:45 a187a288 [app] [I]   Parameters: {"host"=>"server1116.cs.technik.fhnw.ch", "service"=>"ssh", "result"=>0.0, "timestamp"=>1531724094.537153, "acknowledged"=>false, "initial"=>true, "apiv"=>"v2", "monitoring_result"=>{"service"=>"ssh", "result"=>0.0, "acknowledged"=>false, "timestamp"=>1531724094.537153}}
2018-07-16T08:55:45 a187a288 [app] [W] No smart proxy server found on ["puppet", "puppet.cs.technik.fhnw.ch", "server1116.cs.technik.fhnw.ch"] and is not in trusted_puppetmaster_hosts
2018-07-16T08:55:45 a187a288 [app] [I]   Rendering api/v2/errors/access_denied.json.rabl within api/v2/layouts/error_layout
2018-07-16T08:55:45 a187a288 [app] [I]   Rendered api/v2/errors/access_denied.json.rabl within api/v2/layouts/error_layout (0.4ms)
2018-07-16T08:55:45 a187a288 [app] [I] Filter chain halted as #<Proc:0x0000000a61c5b0@/usr/share/foreman/app/controllers/concerns/foreman/controller/smart_proxy_auth.rb:14> rendered or redirected
2018-07-16T08:55:45 a187a288 [app] [I] Completed 403 Forbidden in 5ms (Views: 1.1ms | ActiveRecord: 0.4ms)
2018-07-16T08:55:45 430a2c70 [app] [I] Started POST "/api/monitoring_results" for 10.35.147.116 at 2018-07-16 08:55:45 +0200
2018-07-16T08:55:45 430a2c70 [app] [I] Processing by Api::V2::MonitoringResultsController#create as JSON
2018-07-16T08:55:45 430a2c70 [app] [I]   Parameters: {"host"=>"server1116.cs.technik.fhnw.ch", "service"=>"uptime", "result"=>2.0, "timestamp"=>1531724094.004815, "acknowledged"=>false, "initial"=>true, "apiv"=>"v2", "monitoring_result"=>{"service"=>"uptime", "result"=>2.0, "acknowledged"=>false, "timestamp"=>1531724094.004815}}
2018-07-16T08:55:45 430a2c70 [app] [W] No smart proxy server found on ["puppet", "puppet.cs.technik.fhnw.ch", "server1116.cs.technik.fhnw.ch"] and is not in trusted_puppetmaster_hosts
2018-07-16T08:55:45 430a2c70 [app] [I]   Rendering api/v2/errors/access_denied.json.rabl within api/v2/layouts/error_layout
2018-07-16T08:55:45 430a2c70 [app] [I]   Rendered api/v2/errors/access_denied.json.rabl within api/v2/layouts/error_layout (0.4ms)
2018-07-16T08:55:45 430a2c70 [app] [I] Filter chain halted as #<Proc:0x0000000a61c5b0@/usr/share/foreman/app/controllers/concerns/foreman/controller/smart_proxy_auth.rb:14> rendered or redirected
2018-07-16T08:55:45 430a2c70 [app] [I] Completed 403 Forbidden in 5ms (Views: 1.1ms | ActiveRecord: 0.4ms)

I checked the Smart proxy window in Foreman UI and the foreman server (server1116) is added as a proxy:

Just to make sure, I also had a look again in the /etc/foreman-proxy/settings.yml file, which showed that the server1116 is added as a trusted host:

:trusted_hosts:
  - server1116.cs.technik.fhnw.ch
# Endpoint for reverse communication
:foreman_url: https://server1116.cs.technik.fhnw.ch

So it can get the monitoring results from the machine which exists in Foreman and Icinga but doesn’t display them in the monitoring tab, because of the server is not a trusted host:

Ok, looks like Foreman cannot correctly authenticate the smart-proxy. This should happen via client certs and be done by apache. Can you check there?

Good thinking, that would explain the 403 error. As we can see the result from monitoring in the logs, it must be when Foreman communicates with the Smart proxy.

I wasn’t sure what information is useful to you, but I copied the SSL directives from the /etc/apache2/sites-enabled/foreman-ssl.conf file

  ## SSL directives
SSLEngine on
SSLCertificateFile      "/etc/puppetlabs/puppet/ssl/certs/server1116.cs.technik.fhnw.ch.pem"
SSLCertificateKeyFile   "/etc/puppetlabs/puppet/ssl/private_keys/server1116.cs.technik.fhnw.ch.pem"
SSLCertificateChainFile "/etc/puppetlabs/puppet/ssl/certs/ca.pem"
SSLVerifyClient         optional
SSLCACertificateFile    "/etc/puppetlabs/puppet/ssl/certs/ca.pem"
SSLCARevocationFile     "/etc/puppetlabs/puppet/ssl/crl.pem"
SSLVerifyDepth          3
SSLCARevocationCheck    "chain"
SSLOptions +StdEnvVars +ExportCertData

As I used the foreman-installer, the certificates were generated by puppet therefore the configuration seems to use the correct certificates.

Note: Foreman and foreman proxy are installed on the same machine.

Edit: I find the following log entry peculiar:
2018-07-16T08:55:45 430a2c70 [app] [W] No smart proxy server found on [“puppet”, “puppet.cs.technik.fhnw.ch”, “server1116.cs.technik.fhnw.ch”] and is not in trusted_puppetmaster_hosts

I never configured “puppet.cs.technik.fhnw.ch” and there is no DNS entry for that name. Could this cause the problem, even though the list also has the proper servername “server1116…” ?

Nic

Dear Timo and Dirk

I found the error why the monitoring results from Icinga weren’t displayed in the corresponding hosts in Foreman:

The hosts weren’t assigned a monitoring proxy. Simply editing the host on the All hosts menu and adding the monitoring proxy did the trick. When I added the hosts, I hadn’t yet installed the plugins, which was why I didn’t select an option there :slight_smile:

Now the results are visible in the monitoring tab in the host view. Forgive me my mistake, I wasn’t aware that it would be possible to add multiple monitoring proxies which can be assigned to hosts.

Thanks for your support anyways. I was really glad that you followed-up on my post as it made me feel less lost. +1 on community support!

Cheers,
Nic