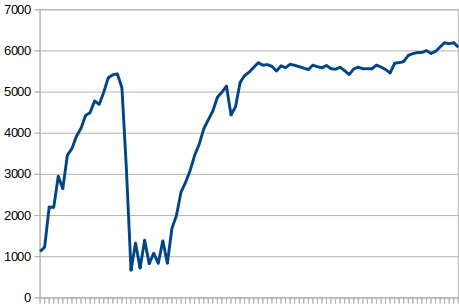
Then I restarted the puppet agent in the two hypervisors and let it run for another hour:
As you can see, the difference is staggering! Then there´s a dip in the RAM usage that quickly goes up again. I think that might be an idle passenger process that was killed because of a setting I have in Apache: PassengerPoolIdleTime 30
So it´s definitely got something to do with the two hypervisor servers (game and hive). Where do we go from here?
Are you using puppetserver (standalone java, used by default with puppet 4 and higher) or puppet master (passenger application, used on puppet 3)? If performance matters I’d highly advise puppetserver. Its initial memory usage might be a bit higher but is much more predictable and scales better.
This would have an improvement especially if your database has a large number of audits in it. To test if this helps, you can try to temporarily create an index in your database and see if it has any impact on load:
CREATE INDEX temp_index ON audits(auditable_id, auditable_type, version)
Another thing to check, that can also reduce general system load, is under Settings → Provisioning → Ignore interfaces with matching identifier. You can add any interfaces that you don’t care about inside foreman, such as the internal virtual interfaces your hypervisors use for their VMs which most likely aren’t relevant in the context of foreman. Creating interfaces is one of the slowest parts of the fact import, so even reducing a few interfaces being imported from the facts can have a significant impact.
If that was slow database, we’d see more time spent in there, but Rails obviously reports just few seconds spent in DB and all the rest (minute or more) was in Rails controllers. That’s weird. To me this looks like more of poor Rails performance than MySQL.
Anyway, can you count how many records you have in these tables: fact_names, fact_values, logs, reports, audits, messages and digests? Out of curiousity.
That seems to be in line with multiple interface creation, I’ve seen cases of multiple minutes (sometimes as much as 15 or more) spent creating interfaces, and time is spent in rails controller, not db.
March 22
If that was slow database, we’d see more time spent in there, but
Rails obviously reports just few seconds spent in DB and all the rest
(minute or more) was in Rails controllers. That’s weird. To me this
looks like more of poor Rails performance than MySQL.
Anyway, can you count how many records you have in these tables:
fact_names, fact_values, logs, reports, audits, messages and digests?
Out of curiousity.
Absolutely! But you’ll have to tell me how, because I´m terrible at
databases
March 22
That seems to be in line with multiple interface creation, I’ve seen
cases of multiple minutes (sometimes as much as 15 or more) spent
creating interfaces, and time is spent in rails controller, not db.
Wow, that is phenomenally bad! (from a users point of view, I mean,
I´ve no idea what this process requires code-wise) It does seem like a
perfect match to what I´m experiencing, so I´ll check that out and
report back after it´s evaluated!
Seems like if it can become this bad with just two clients, it should
be communicated a lot more clearly, that if you want to manage e.g.
10-15 hypervisors, you have to do this, or else your Foreman server
is going to explode!
Or maybe I´ve just missed it? Or is there work scheduled for
improvement in this particular area, if at all possible?
1.17 will default to include more ignored interfaces for openshift and openstack ('tap*', 'qbr*', 'qvb*', 'qvo*', 'qr-*', 'qg-*', 'br*', 'veth*', 'vlinuxbr*', 'vovsbr*'), but if you have some others (your logs seem to indicate jumbo* if I understand correctly) ignoring them will speed fact processing up and hopefully reduce the general system load.
Looking into the logs you uploaded, looks like the interface processing in your case took about 5 minutes - while this might be caused by completely unrelated load, I would test if ignoring some of them causes reduced load.
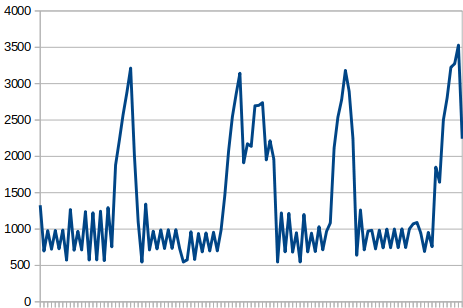
Well, I added the excludes I have to both “Ignore interfaces with matching identifier” and also “Exclude pattern for facts stored in foreman”, restarted apache and started to monitor RAM usage like before, and here it is:
I´d say it helped a little with average usage but did nothing for when the two hypervisors where running. As you can see, the usage spiked and fell again after the next 5 minute interval for when ‘passenger-recycler’ kicked in. Had I disabled ‘passenger-recycler’, I expect the graph to go have gone as rampant as the last one.
This still smells to me like something with the hypervisor fact processing causing the extra load. Perhaps they have a large number of block devices? Would you be able to provide us with the facter output from the hypervisors?
Ok, so it doesn’t seem like block devices. There are 16 and 19 interfaces on them, could you share the setting you have in place for Ignore interfaces with matching identifier? maybe something there is wrong leading to some of the interfaces still being created.
Adding interface filter is not enough, you also need to delete rogue records from your database. Our code keeps loading them into memory every report, that’s what’s make your memory consumption high. There is a rake task that does the job for you, recently it has been refactored to take filters into account:
You only need to run this task if you change the ignored interface list, to ensure there aren’t any leftover interfaces. Out of curiosity, how long did it take to clean all of those interfaces?
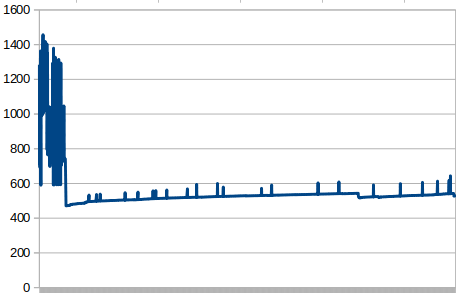
I can hear the fat lady singing guys! So I left it for reeeally long sample and look:
And this is with ‘passenger-recycler’ disabled to! Also, the load on the server has gone from like a steady three to like a point five or so, very nice!
So I think we can mark this case as solved, with a big fat red sticker that says: “Make damned sure to disable unnecessary network interfaces!”
Thank you so much guys, I´ve learned so much about how to debug this application and how the memory management system works (and not)