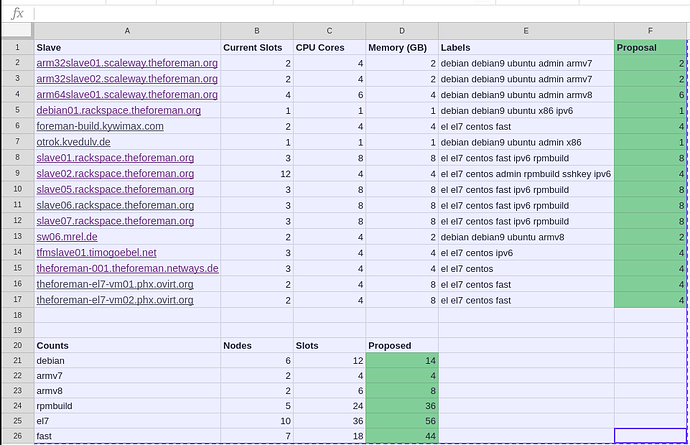
While doing some other work, I thought I’d look at our current Jenkins node executor slots compared to CPU cores and memory. The baseline rule of thumb is to do 1 executor per CPU core. We have a mixture of longer running and quick jobs along with varying OSes that are taken into consideration. I don’t believe we’ve done much active tweaking or monitoring to know whether we are under utilizing or over utilizing slaves currently. In some cases, the slots / cores ratio seemed out of balance. The image below shows both the current numbers with some counts below per type with a proposal towards the 1:1 ratio in most cases as a first pass at expanding our throughput.
Nice work. We can also throw in the OSUOSL slaves as well, although I’m reserving at least one of those 
Looks good to me. Out of curiosity what was the reasoning that led to what is currently being used?
Good question @Zhunting but I honestly don’t know it was so long ago. I wonder if it was an attempt to reduce load on a given slave but that’s hard to know despite my searching. I’d be inclined to up the executors on some of those and keep an eye out for increased load or decreased.
Well, +1 from me maybe see what the results are in two weeks and go from there?
One thing to consider is IO. I don’t know how the various slaves are (lack of monitoring) but I can imagine we had some slaves with slow IO and thus reduced slots. I’d be nice to get some actual numbers from before and after.
Monitoring is on my hit list. Maybe it’s time.to speak to @Dirk … 
What I have done for the moment is bump a few of the obvious ones (mostly the Rackspace slaves from 3 to 6) a bit higher to see trends over the next week or so. The ones I bumped are all “fast” meaning SSDs so least likely to take an I/O performance hit.
If monitoring reaches the top of the list, feel free to contact me. 
I can help with concept and implementation as I will get some time for Foreman Project if I need some, perhaps NETWAYS can also help with hosting it. I am sure also some others like @ekohl or @mmoll can help with maintaining it.
So I would do some availability monitoring with Icinga 2, forwarding metrics to Graphite and perhaps Grafana. If some additional or more detailed metrics are required like the IO utilization of the Jenkins Slaves, another tool like collectd can also be used to get metrics to Graphite and afterwards queried with Icinga 2 to allow notification been send always in the same fashion.
I’d definitely like to get some basics up and running ASAP. Even just knowing basic things like the response times on CI / Redmine / Discourse would help us proactively respond to issues. I’ll poke you next week 
I did reduce the slots on the rackspace slaves again, as they were heavily swapping under load. Per slot over 1GB of RAM is needed for the ruby process and then more RAM for the database. In addition fast I/O is needed.
DId you reduce them back to 3 or can we get away with 4 slots on those doing a 2:1 CPU to memory ratio?
I did set it to 4 slots, let’s see, how it works…

