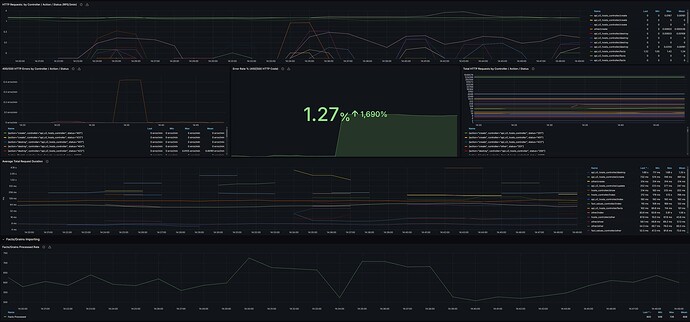
Although Foreman can be configured to expose internal telemetry data via both statsd and prometheus, due to issue in ruby_client prometheus library, the only possible way currently is via statsd. Here is how to do it.
Download Prometheus and statsd_exporter. In this turorial, let’s use binaries directly for simplicity and /tmp directory to store configuration. This is not recommended for production deployments, install from distribution packages or via containers and pay attention to firewall (statsd use UDP protocol) and SELinux.
For production deployments, always install statsd_exporter on the Foreman host and Prometheus on a remote host. In this tutorial we are using the same host.
wget https://github.com/prometheus/prometheus/releases/download/v2.23.0/prometheus-2.23.0.linux-amd64.tar.gz
wget https://github.com/prometheus/statsd_exporter/releases/download/v0.18.0/statsd_exporter-0.18.0.linux-amd64.tar.gz
tar xzvf statsd_exporter-0.18.0.linux-amd64.tar.gz
tar xzvf prometheus-2.23.0.linux-amd64.tar.gz
Now, generate mapping file for Foreman metrics so statsd_exporter handles labels and types correctly:
foreman-rake telemetry:prometheus_statsd output=/tmp/statsd_mapping.yml
Start the exporter, by default it listens on TCP/UDP 9125 and metrics are exposed on 9102:
./statsd_exporter-0.18.0.linux-amd64/statsd_exporter --statsd.mapping-config=/tmp/statsd_mapping.yml
Configure Prometheus:
global:
  scrape_interval: 15s
  evaluation_interval: 30s

scrape_configs:
- job_name: foreman
  static_configs:
  - targets: ['localhost:9099', 'localhost:9102']
EOF
Start Prometheus, use port 9099 instead of 9090 for Katello deployments (9090 is already used):
prometheus-2.23.0.linux-amd64/prometheus --config.file=/tmp/prometheus.yml --web.listen-address="0.0.0.0:9099"
The final step is to configure Foreman to send telemetry data to 9125 (UDP):
foreman-installer -v --foreman-telemetry-statsd-enabled true --foreman-telemetry-statsd-host 127.0.0.1:9125
That’s all, Foreman 2.3 exposes the following metrics:
| Metric name | Labels | Type | Description |
|---|---|---|---|
| fm_rails_activerecord_instances | class | counter | Number of instances of ActiveRecord models |
| fm_rails_audit_records_created | type | counter | Number of audit records created in the DB |
| fm_rails_audit_records_logged | type | counter | Number of audit records sent into logger |
| fm_rails_bruteforce_locked_ui_logins | counter | Number of blocked logins via bruteforce protection | |
| fm_rails_config_report_metric_count | metric | counter | Number of config report status metrics |
| fm_rails_failed_ui_logins | counter | Number of failed logins in total | |
| fm_rails_http_request_db_duration | controller,action | histogram | Time spent in database for a request |
| fm_rails_http_request_total_duration | controller,action | histogram | Total duration of controller action |
| fm_rails_http_request_view_duration | controller,action | histogram | Time spent in view for a request |
| fm_rails_http_requests | controller,action,status | counter | A counter of HTTP requests made |
| fm_rails_importer_facts_count_input | type | counter | Number of facts before imports starts per importer type |
| fm_rails_importer_facts_count_interfaces | type | counter | Number of changed interfaces per importer type |
| fm_rails_importer_facts_count_processed | type,action | counter | Number of facts processed (added, updated, deleted) per importer type |
| fm_rails_importer_facts_import_duration | type | histogram | Duration of fact import (ms) per importer type |
| fm_rails_importer_facts_populate_duration | type | histogram | Duration of fields population (ms) per importer type |
| fm_rails_ldap_request_duration | histogram | Total duration of LDAP requests | |
| fm_rails_login_pwhash_duration | algorithm | histogram | Duration of password hash algorithm |
| fm_rails_proxy_api_duration | method | histogram | Time spent waiting for Proxy (ms) |
| fm_rails_proxy_api_response_code | code | counter | Number of Proxy API responses per HTTP code |
| fm_rails_report_importer_create | type | histogram | Total duration of report import creation |
| fm_rails_report_importer_refresh | type | histogram | Total duration of report status refresh |
| fm_rails_ruby_gc_allocated_objects | controller,action | counter | Ruby GC statistics per request (total_allocated_objects) |
| fm_rails_ruby_gc_count | controller,action | counter | Ruby GC statistics per request (count) |
| fm_rails_ruby_gc_freed_objects | controller,action | counter | Ruby GC statistics per request (total_freed_objects) |
| fm_rails_ruby_gc_major_count | controller,action | counter | Ruby GC statistics per request (major_gc_count) |
| fm_rails_ruby_gc_minor_count | controller,action | counter | Ruby GC statistics per request (minor_gc_count) |
| fm_rails_successful_ui_logins | counter | Number of successful logins in total |
Histograms are mapped to histograms or summaries, depending on mapping configuration. This can be changed as needed.
Troubleshooting
Make sure to use 127.0.0.1 for the endpoint where Foreman should send UDP packets. Do NOT use localhost because first resolving hostname for every UDP communication is slower, but also this can sometimes resolve to IPv6 address which can have unexpected results (e.g. in containers).
If metrics are not showing up, allow ports 9099 and 9102 (e.g. firewall-cmd --add-port="9102/tcp" --add-port="9099/tcp") and visit /metrics URL to confirm. Check Foreman configuration, make sure to restart the service. Check firewall (docker/podman has some bugs around UDP redirection) and check SELinux.

